13) A Brief Introduction
Ludwik Kowalski
Department of Mathematical Sciences
Montclair State University, Upper Montclair, NJ, 07043.
Return to the clickable list of items
What follows is a paper on what used to be called, quite inappropriately, Cold Fusion. Several names have been proposed to replace this misleading name. My own preference evolved toward anomalous energy (AE) phenomena. This name focuses on the unexplained energy puzzle without trying to impose a premature interpretation. I am still not certain that AE is real but I think that scientific papers, including the one below, should be validated scientifically. I met the author of the paper at the International Conference on Emerging Nuclear Systems (ICENES2002) and became interested. He is a Russian scientist who has been conducting AE experiments for more than a decade. Two of his presentations have been published (1,2) in the ICENES2002 report.
As a Russian speaker I was able to help the author improve his presentation in English, a language in which he is far from fluent. We talked about his paper before it was formally presented, and we discussed it afterwards. What I heard in Russian was much clearer than his English translation. That is why I decided to improve it and asked the author to send me the original Russian text. He did this and I paraphrased it. The goal was to improve the readability of what may turn out to be a very significant scientific contribution. The text that follows is based on the original Russian paper, on conversations with the author and on what was presented at the conference. Naturally, I tried to stay as close to the original as possible. The author made several corrections and allowed me to make the paper available over the Internet. A large number of relatively recent articles about the AE phenomena are now available (3).
Claims made in the article are highly unusual and I am puzzled. Will Dr. Karabuts experimental findings, said to be ~100% reproducible, be confirmed by other competent scientists? I do not know; I am a physics teacher and only a part-time nuclear researcher. It was a great challenge to learn and to write at the same time.
(1) A.B. Karabut, Research into Powerful Solid X-Ray Laser (wave lengths
0.8 to 1.1 nm) with Excitation of High Current Glow Discharge Ions.
(2) A. B. Karabut, See the article below.
(3) These articles can be downloaded from http://lenr-canr.org/Features.htm
Return to the clickable list of items
Generation of Heat, Long-Living Atomic Levels in the Solid Medium (1 to 3 keV) and Accumulation of Nuclear Reaction Products in a Cathode of a Glow Discharge Chamber
A.B. Karabut
FSUE "LUTCH"
24 Zheleznodorozhnaya St. Podolsk, Moscow Region, 142100, Russia.
email: 7850.g23@g23.relcom.ru
This paper was presented at the 11th International Conference on Emerging Nuclear Energy Systems, Albuquerque, New Mexico, USA, October 2002.
Return to the clickable list of items
Abstract:
The described experimental results, based on (1), describe processes associated with the excess heat generated in a deuterium discharge chamber. A calorimetric method was used to demonstrate that thermal energy produced in the chamber can exceed the electric energy supplied to it by as much as 10%. The excess energy is attributed to nuclear reactions taking place near the surface of the palladium cathode bombarded by positive ions of very low energy (0.5 to 2 keV). The process is accompanied by the emission of protons (3 MeV), alpha particles (14 MeV), soft X-rays (up to 100 R/s) and the production of heavy nuclides (at the rates of up to 1013 atoms per second). Most of the results were statistically significant and 100% reproducible.
1) Excess Heat Measurements in a Flow Calorimeter
The apparatus used in these experiments consisted of a chamber pumped out down to 10-3 Torr and filled with hydrogen or deuterium up to 10 Torr (see Figure 1). The glow discharge was established between parallel plates, palladium-covered cathode and a Mo anode, separated by several milimeters. Other cathode materials, and other gases, were used in control experiments. The cathode, the anode, and the body of the chamber were water-cooled using three independent circuits. Each circuit was equipped with two thermoresistors, one at the input and one at the output, plus a flow meter.
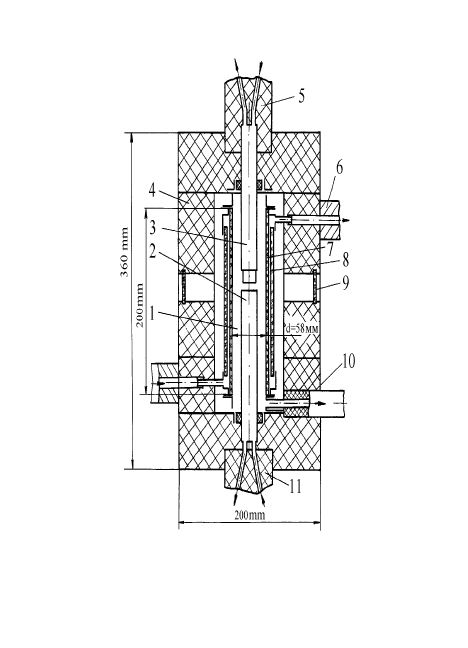
Figure 1 (left): The glow discharge chamber used as a continuous flow calorimeter. (1, the discharge chamber; 2, cathode unit; 3, anode unit; 4,thermal insulation cover; 5, insulation of the anode cooling system; 6, the chamber cooling system; 7,the discharge chamber tube; 8, the chamber jacket tube; 9, windows in thermal insulation cover; 10, the vacuum hose; 11, insulation of the cathode cooling system.)
********************************************************
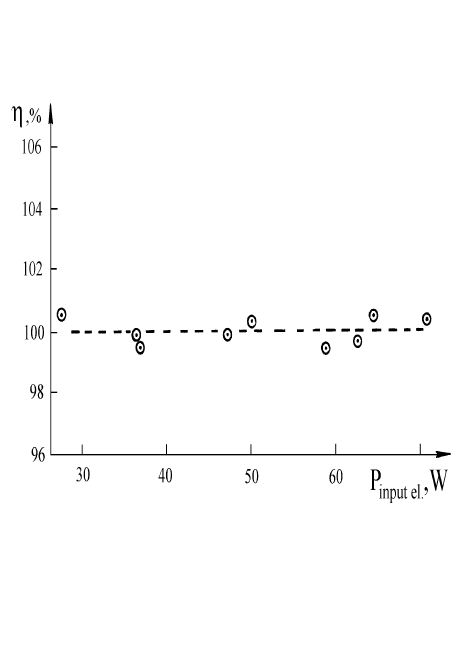
Figure 2: Results of calorimeter calibrations. Nearly 100% of electric energy supplied is removed as heat when the current was flowing through ohmic resistors placed inside the chamber.
***********************************************************
The heat excess rates, that is, differences between the thermal output wattage and the electrical input wattage, were measured using the Pd cathode in the deuterium gas. The results are shown in Figure 3a. The heat excess rate depends on the following parameters: current density in the discharge chamber, applied voltage, duration of current impulses (t) and duration of intervals between the pulses (T-t). Note that T is the period of repetition, the inverse of the frequency, from 100 up to 1000 Hz, of the electric pulse generator. The value of excess wattage tends to increase with input wattage. Note that excess power also increases with the time between the current pulses, (T-t). This indicates that releases of heat in the cathode continue to take place after the current is turned off (that is, between the consecutive current pulses). The largest excess of power takes place when the difference of potential is between 1000 and 1400 volts; further increase in the voltage results in a rapid decrease of the excess power.
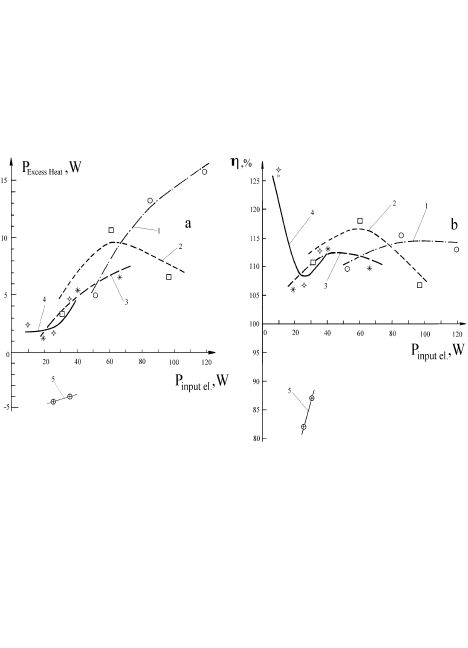
Figure 3 (left): Excess heat power versus the electrical input power for the palladium cathode in deuterium at the pressure of 10 Torrs. The distance between the anode and cathode was 11 mm. Different curves in correspond to different duty cycles of the electrical power supply.
Figure 3b (right): Heat removed as a percentage of supplied electric energy. Different curves correspond to different duty cycles of the electrical power supply.
**********************************************************
Each curve in 3a or 3b corresponds to a different value of t/T, where t is the duration of the current pulse and T is the period of repetition. The curves labeled as 1,2,3 and 4 correspond to t/T being 0.22, 0.16, 0.11; and 0.054, respectively.
At some pressures (inside the discharge tube) the power excesses were found to be negative, as shown above (curves labeled as 5). Further investigations revealed that this is accompanied by a laser-like emission of X-rays, to be discussed later.
In several reproducible experiments the total measured energy released from the palladium cathode was 4 MJ during the total time of 120 hours This amounts to a mean rate of excess heating equal to 9.2 W, as illustrated in Figure 4. Measured excess heat rates could not possibly be attributed to a chemical reaction inside the chamber. The slight decrease of the excess power was most likely associated with the progressive deterioration of the palladium cathode.
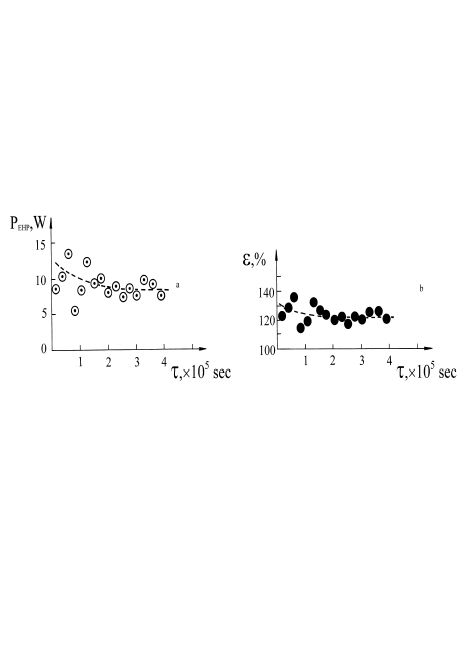
Figure 4a (left): Dependence of the excess heat power on the duration of experiments. System Pd-D2; t/T=0.13, current 220mA.
Figure 4b (right): ): Same system as in 4a. Dependence of the total heat removed (expressed in terms of percentages of input power) on the duration of experiments.
************************************************************
2) Registration of Charged Particles
Protons and alpha particles were observed in a setup with a displaced anode, as indicated in Figure 5. They were counted by using plastic track detectors (purified CR-39, Fukuvi Chemical Industry, Japan). The methodology of detection was similar to that used in testing for radon. The observed average rates of emission turned out to be between 10 and 15 particles per second (up to 250 tracks per square centimeter of the detector area and per 6 hours). Some of the detectors were positioned to see the cathode, others were used to determine the background radiation inside the apparatus. Detectors was wrapped in protective Al foils of thickness between 11 and 33 microns. Protons with energies up to 3 MeV, and alpha particles of 14 MeV, were detected in experiments with the Pd, Ti and Ni cathodes (but not the Ta cathode) exposed to the deuterium plasma. The dependence of the number of tracks on the distance from the cathode, r, was found to be consistent with the 1/r2 law.
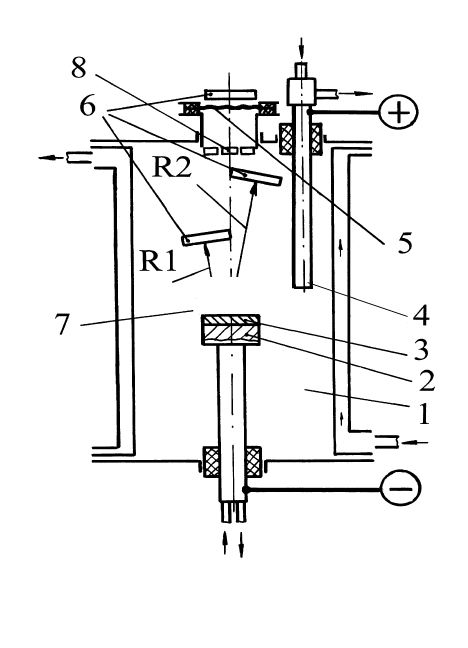
Figure 5: Experimental setup to study emission charged particles and x-rays. (1, discharge chamber, 2, cathode holder; 3, cathode, 4, anode, 5, beryllium window; 6, CR-39 track detectors; 7, glow discharge region; 8, TLD detectors.)
*************************************************************
A control experiment with the Pd cathode and ordinary hydrogen showed that the density of tracks in the detectors exposed to the cathode was essentially the same as in the background. In other words, protons seemed to be emitted from the Pd cathode exposed to the D plasma but not exposed to the H plasma, as illustrated in Figure 6. The left side graphs show distributions of proton track lengths in D plasma (each for different thickness of Al foils) while the right side graphs show corresponding distributions in the H plasma. As previously indicated, tracks recorded in the H plasma can be viewed as the background not associated with the processes inside the cathode.
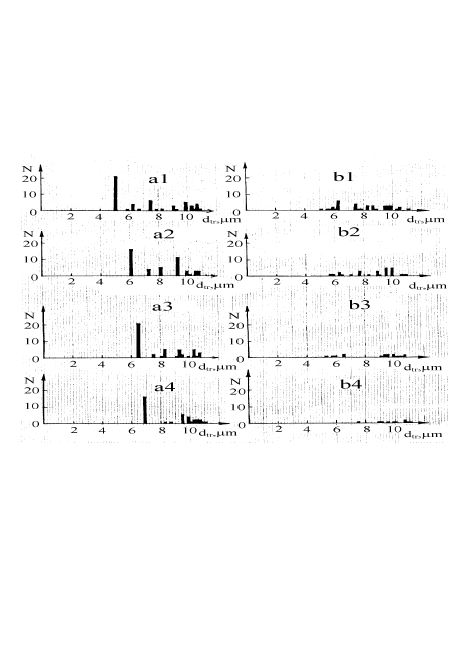
Figure 6: Distributions of lengths of tracks in the CR-39 detectors recorded in the deuterium plasma (left side spectra) and in hydrogen plasma (right side spectra). The protective covers were: 11 microns of Al for a1 and b1, 11 microns of Al plus 60 microns of polyethylene for a2 and b2, 22 microns of Al plus 60 microns of polyethylene for a3 and b3, 33 microns of Al plus 60 microns of polyethylene for a4 and b4. The left side spectra (in deuterium) were collected in ten hours of discharge while the right side spectra (in hydrogen) were collected in five and a half hours of discharge.
********************************************************
The rates at which alpha particles and protons are emitted, at different voltages, and at two different currents, are shown in Figure 7. Note that the dependence of Dn (particles per second in all directions) on the discharge voltage is more or less exponential. The recorded rates, however, are much too small to be responsible for the observed excess heat power. It is conceivable that protons are associated with DD reactions; the emission of 14 MeV alpha particles remains a mystery.
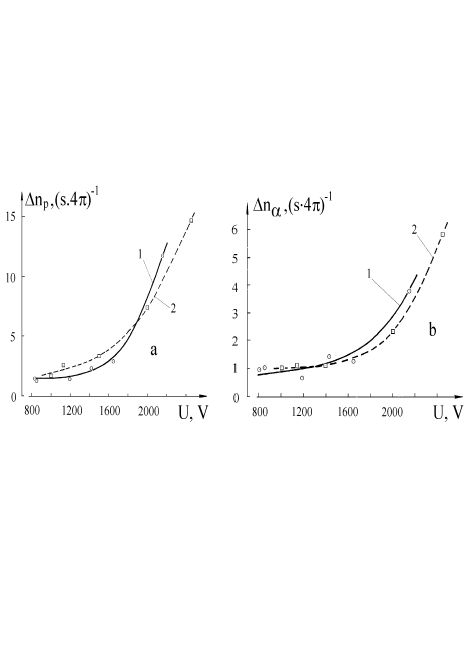
Figure 7a (left): Emission rates of 3 MeV protons at different discharge voltages. 1, for the discharge current of 220 to 300 mA; 2, for the discharge current of 370 to 450 mA (Ti cathode in D2).
Figure 7b (right): Emission rates of 14 ± 3 MeV alpha particles at different voltages. 1, for the discharge current of 220 to 300 mA; 2, for the discharge current of 370 to 450 mA (Ti cathode in D2).
***************************************************************
3) Registration of Gamma Rays.
A Ge-Li detector connected to a multichannel analyzer was used to detect gamma radiation between 0.1 and 3 MeV. To reduce the outside background, the detector and the chamber were shielded by 10 mm of lead. Numerous radioactive isotopes responsible for the emission of gamma rays were identified on the basis of characteristic spectral lines. Gamma ray spectra, recorded during the discharge, and at different times after the discharge, are shown in Figure 8. In a typical experiment the discharge was turned off after tens of hours of the exposure to plasma and gamma rays could be observed for up to eight days before being reduced to the background level. The gamma ray background spectra were recorded during prolonged time intervals (up to several months) between the experiments (starting 10 to 14 days after turning the discharge off). The duration of a background recording could be as short as one hour or as long as 65 hours; fluctuations of background spectra were less than 10%.
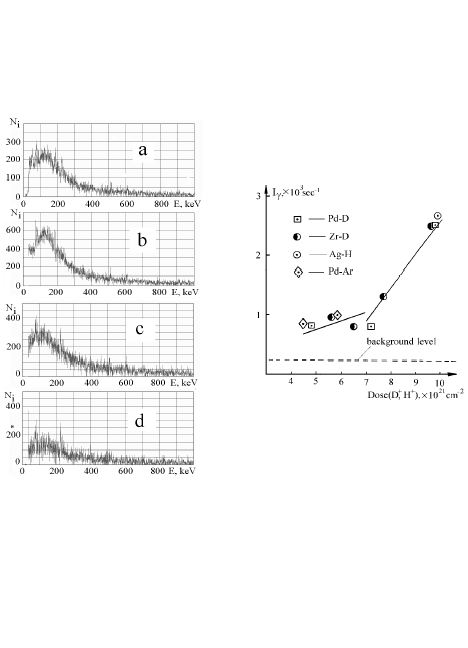
Figure 8 (left): Progressive decrease of gamma radiation after ending an experiment in which a palladium cathode was exposed to the deuterium plasma. The (a) spectrum a was recorded during the discharge, the (b) spectrum was recorded one day after turning the discharge off; the (b) spectrum was recorded two days later; the (c) spectrum was recorded six days later; the (d) spectrum was recorded eight days later.
Figure 9 (right): Dependence of the intensity of gamma rays (at the end of an experiment) on the total number of current ions per unit area. Different symbols are used to distinguish four different combinations of cathode and gas, as labeled.
*************************************************************
The recorded counts per second were subsequently converted into absolute gamma ray intensities, I, expressed in counts per second, in all directions. This was done by assuming that the distribution of gamma rays is isotropic, by taking into account the geometry and by using known detector's efficiencies. The dependence of I on the exposure to plasma, immediately after a discharge, is shown in Figure 9. Note that the exposure to plasma is expressed in terms of numbers of ions per unit area. The dependence is more or less exponential and, surprisingly, not very different for the four cathode-gas combinations (Pd in D, Zr in D, Ag in H and Pd in Ar).
Groups of radioactive nuclides of half-lives ranging from 1 to 8 days were identified in the Pd cathode after its exposure to the D plasma for 8 days. The spectra shown in Figure 8 were analyzed in terms of two components: peaks and continua. The peak component exceeded the background by a small delta factor ranging from 2.5 to 5, depending on peaks. The continuous component, on the other hand, exceeded the background by a delta factor ranging from 8 to 10. The analysis of data, based on (2), led to the conclusion that gamma rays are emitted from the neutron-deficient (and thus beta-radioactive) nuclides with atomic mass numbers ranging from 16 to 136. In particular, all products of the following A=101 chain:
Rb -> Sr -> Y -> Zr -> Nb -> Mo -> Tc -> Ru
were identified on the basis of numerous peaks, as summarized below. The numbers shown are peak energies in keV.
         Rb/Sr   Sr/Y   Y/Zr   Zr/Nb   Nb/Mo   Mo/Tc   Tc/Ru


         111.6  128.3   98.3   119.3   157.5   119.9   306.85

         271.6  163.4  118.7   140.6   180.7   533.5   545.06

         251.6  474.1  216.9   373.9   276.1   590.9   623.8

         363.1  510.7  133.8   597.8   280.2  1012.5   489.1

          92.8  590.4  104.4   597.8   294.6   713.0   344.0

                 232.7  666.6  146.9   722.2   466.3  1599.3

                1091.8  694.3  661.8   912.2   810.8  1590.1

                1362.9  744.1  668.7  1095.8   797.1  1759.8

                       1124.8  729.7  1924.5  1042.6  2032.1

                       1062.9         2009.5          2041.2

                                      2565.4          1957.6
It is remarkable that the first three nuclides are known emitters of fast neutrons (31%, 2.37% and 1.94% respectively) and that all gamma lines associated with the above A=101 chain were actually identified in the recorded spectra. Rates of production of various nuclides were calculated from the areas below the peaks on the basis of known efficiencies of detection. The beta radioactive chains of A=16,17, 23, 30, 46, 47, 51, 54, 55, 58, 63, 64, 71, 75, 80, 84, 92, 97, 99, 100, 101, 102, 103, 104, 105, 106, 107, 108, 109, 110, 118 and 123 are main contributors of the observed gamma rays. The rates of production of gamma-radioactive atoms did not exceed 105 per second. Most of the atoms produced in the cathode turned out to be non-radioactive, as described in the next section.
4) Accumulation of Trace Elements.
Assuming that most of the excess heat is associated with nuclear reactions taking place in the cathode, the material near its surface was often analyzed after prolonged discharges. Average rates of accumulation are displayed in Figure 10a. The horizontal dotted lines refer to the average rates of emission (of these nuclides) needed to produce the excess heat rates of 10 W and 1 W, as indicated. Drastic alterations of isotopic ratios were discovered as illustrated in Figure 10b. The percentage of 13C, for example, changed from about 1% (natural) to about 20% (due to the discharge). Asterisks refer to absent isotopes. The 58Ni isotope, for example, whose natural abundance is nearly 68% was not found among the trace elements produced during the discharge.
The methods used were: secondary ion mass spectrometry, secondary neutral mass spectrometry and spark mass spectrometry. The first method consisted of the following procedures: removing the outer defective layer of 1.5 nm by plasma etching and scanning the 5 nm layer to determine the concentrations of trace nuclides. Then a layer of 100 nm was removed and another layer of 5 nm was scanned. The procedure was repeated two more times to study the distribution of trace nuclides up to the depth of 400 nm. In one case, for 57Fe, steps were considerably shorter than 100 nm, as illustrated in Figure 11. The absence of 58Ni, 70Ge, 73Ge, 113Cd and 116Cd isotopes, and high abundance of 13C, 57Fe and 48Ti isotopes, seem to be typical of processes contributing to generation of the excess heat.
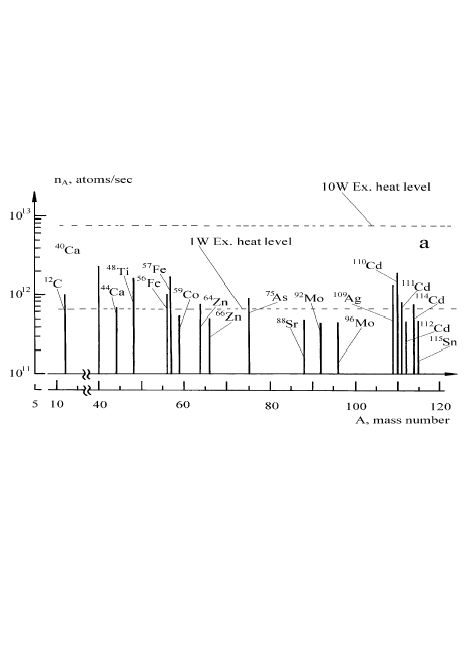
Figure 10a : Average rates of acumulation of different trace nuclides produced in the 100 nanometer layer of the palladium cathode bombarded by deuterium ions. The average current (during the four hours) was 100 mA.
***********************************************************
These data were obtained after the four-hour Pd-D discharge at the current of 100 mA and pressure of 10 Torrs. The natural concentration of 57Fe is known to be 2.2% while the observed concentrations were found to be much higher. They changed from 50%, near the surface, to about 30% at the depth of 400 nm. Strongly "unnatural" isotopic ratios were found in other trace elements, as illustrated in Figure 10b. Many naturally abundant isotopes, such as 58Ni, 70Ge, 73Ge, 74Ge, 113Cd and 116Cd, were simply not present.
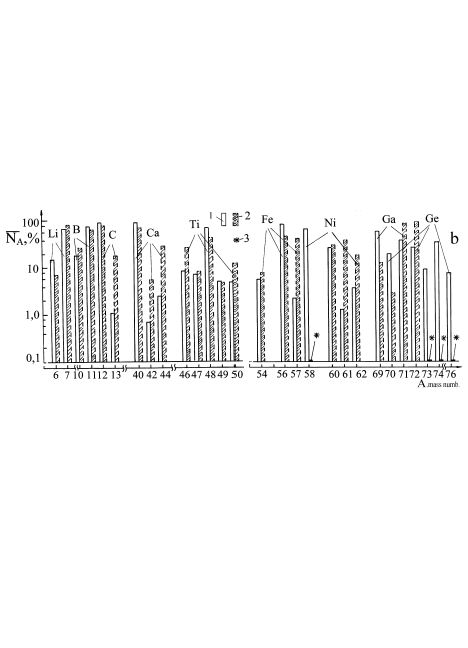
Figure 10b: Crossed bars show percentages for some isotopes at the end of one four-hours-long bombardment of a palladium cathode by deuterium ions. These can be compared with the adjacent left-side bars (clear) referring to natural isotopic percentages. Difference between heights of adjacent bars illustrate isotopic anomalies resulting from the bombardment of Pd by deuterium ions.
************************************************************
Absolute concentrations of trace elements were obtained by subtracting concentrations found in the unused palladium from the concentrations found in the cathodes exposed to the deuterium plasma. The elements accumulated in the exposed cathode could be subdivided into three groups: those whose atomic masses were close to Pd, those whose atomic masses were approximately two times smaller and those whose atomic masses were below 40. The identified isotopes, those whose abundance was higher than 1%, were: 7Li, 12C, 15N, 20Ne, 29Si, 44Ca, 48Ca, 56Fe, 57Fe, 64Zn, 66Zn, 75As, 107Ag, 109Ag, 110Cd, 111Cd, 112Cd and 114Cd. Most of them were found in the first 100 nm layer of the cathode. The rates of production of these isotopes, shown in Figure 10a, were estimated by dividing the total number of accumulated atoms by the duration of the experiment, 20,000 seconds. It seems that nuclear reactions producing 12C, 44Ca, 48Ti, 56Fe, 57Fe, 59Co, 64Zn, 66Zn, 75As, 107Ag, 109Ag, 110Cd, 111Cd, 112Cd, 114Cd and 115Cd are the strongest contributor to the production of the excess heat, as illustrated in Figure 10a. The dashed horizontal lines of that figure are drawn to indicate average rates of production nuclides necessary to generate heat at the level of 1 W and 10 W, as indicated.
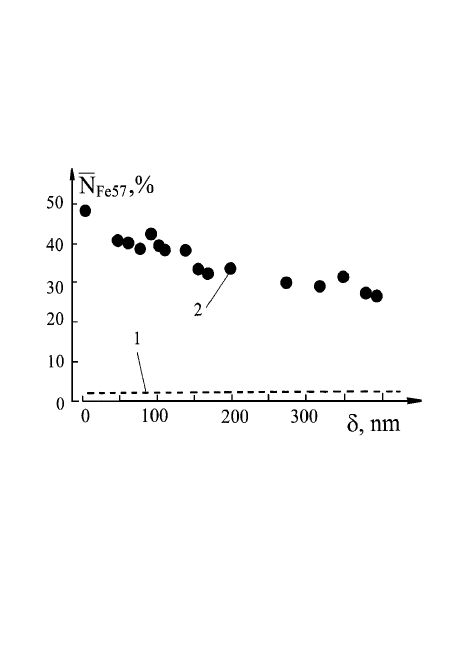
Figure 11: Dependence of the percentage of 57Fe on the distance from the surface of the palladium cathode bombarded for four hours by deuterium ions (2000 volts and 100 mA).
***********************************************************
5) Emission of soft X-rays.
As previously indicated, the plasma discharge was often associated with the emission of soft X-rays. They were studied with the a TLD and with the scintillation detector mounted on the photomultiplier. The intensity of X-rays was found to increase rapidly with the discharge current, as illustrated in Figure 12. The currents between 100 mA and 300 mA were obtained by changing the difference of potential from 800 V to 2000 V. The dependence of the X-rays intensity on the current is more or less the same for all cathode-gas combinations.
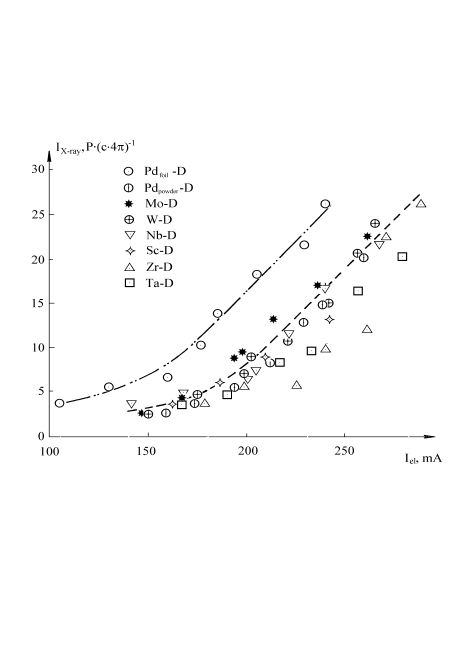
Figure 12: The dependence of the x-ray intensity, in roentgens per second per 4p, on discharge current for the palladium cathode in deuterium (open circles) and for other cathode-gas combinations (as indicated). The data were obtained using a calibrated scintillation detector. The discharge voltages ranged from 800 to 2000 V.
**************************************************************
Bursts of X-ray emission were also observed several minutes to several hours after turning the current off. It was noticed that only prolonged exposures to plasma (at least 10 to 20 minutes) resulted in post-discharge bursts. Statistical analysis of the time distribution of bursts is consistent with the idea that excited levels, with energies between 1 keV and 2 keV, are populated inside the cathode during the ionic bombardment. The life times of these exited solid state levels, however, are presumably discrete (up to several msec).
6) Discussion:
The high-current glow discharge experiments, described above, revealed: 1) the existence of excess heat production, 2) progressive accumulation of small amounts of isotopes of several elements near the surface of the cathode, 3) emission of penetrating radiation and 4) emission of charged particles. These are manifestations of a previously unknown fundamental phenomenon. It consists of the excitation of metastable states (energies 1-2 keV, lives tens of miliseconds) inside the crystaline material. These L,M states are presumably populated via inelastic interactions of plasma ions with the L,M electronic shells of the ions in the solid cathode. It is natural to postulate that nuclear reactions recorded in this study were initiated by formation of such states. Here is a general description of observed processes and products:
1) Under properly chosen conditions (pressure and distance between the electrodes), a region near the cathode becomes an ionic conductor. More than 90% of the applied potential difference, and more that 90% of the electric power, appears in that region. Positive ions are accelerated here up to energies between one and two keV.
2) The accelerated ions interact with the ions of the solid cathode material in several atomic layers near the surface. Such interactions are basically different from similar processes at higher energies (10 keV and above). The low energy processes can be described as:
D+* +Pd4+ --> Pd4+* + D+
where Pd4+* is the positive palladium ion with the excited L, M electronic shells while Pd4+ is the ground state palladium ion in the crystal lattice of the cathode. The calorimetric measurements, and the evaluation of the maximum power of X-ray laser emission show that at least 20% of the power put into the discharge is used to populate the excited Pd4+* states, that is to initiate processes resulting in nuclear reactions.
3) The L, M excitation of ions near the solid body surface spreads into the depth of the material with the speed of an electromagnetic wave. Deexcitations (relaxations) and conversion processes take place inside the cathode.
4) It is reasonable to assume that the excited L,M levels are of a dipole oscillation nature. They deexcite along the two competing paths:
a) direct transitions to the ground state resulting in the emission of X-ray photons.
Pd4+* --> Pd4+ + X-ray
b) transfer of energy to one of the electrons of the inner shell (K, L, M) resulting in the ejection of this electron. The created vacancy is filled by an electron from an outer shell and a photon of a characteristic X-ray is emitted.
Pd4+* --> Pd4+ + e- + X-ray
5) High current density is responsible for the high rate of populating of L,M levels and thus for the creation of an active layer with the inverted population. Fast relaxation of long-lived excited dipole-oscillation levels of ions results in X-ray. This is possible when the population density of L,M levels is sufficiently high due to a sufficiently large current density and when amplification is large. Under such conditions a laser beam burst can be generated through a single pass across the population inversion region (without mirrors).
6) Thus each current pulse results in the excitation of L,M levels of the solid material. The density of population is n v-d (cm-3) and the characteristic L,M temperature, TLM is 1-2 keV (more than 20,000,000 K). The characteristic times of these excited isomeric states, tLM, can exceed 10 ms. Among the nuclear reactions taking place in such an environment one can possibly consider:
105Pd --> [Pd]* --> 48Ca + 57Fe+ 15.976 MeV,
splitting of the excited Pd into two transmutation products, or
105Pd + 2D --> [Pd;D]* --> 107Ag + 13.124 MeV,
formation of the excited silver nucleus followed by its deexcitation. Experimental data seem to indicate that the released nuclear energy does not appear in the form of kinetic energies of splitting fragments.
7) The probability of such reactions, and the corresponding rate of excess heat, are determined by the difference between the actual value of (nLM*tLM) and some minimum value of this product. This is analogous to the well-known Lawson criterion used to evaluate the excess heat in thermonuclear reactions. Note that the population density, nLM, depends on the design of the cathode and on the parameters of discharge plasma. The characteristic time, tLM, on the other hand, depends on the intensity of X-ray emission. To maximize the excess heat the population density must be as high as possible while the emission of X-rays must be reduced to increase the tLM.
8) It is reasonable to think that the excitation of L,M levels is transmitted into the solid material in the form of transverse waves. For the flat cathode geometry (see Figure 1) the deexcitation of L,M levels is responsible for the decrease in population density (nLM) with the depth of penetration. The rate of transmutation reactions should consequently decrease with depth. Such expectation seems to be confirmed experimentally; the concentration of reaction products decreases with the depth. The situation, however, may be quite different for a cylindrical or spherical geometry. In such cases one may create conditions in which the density of population, nLM, increases with the depth leading to a possible explosion.
9) It is conceivable that a solid cathode whose metastable levels have very long lives can be used as a heat storage cell. The storage capacity of such a cell can be as high as 2108 Joule/cm3.
REFERENCES
1. A.B. Karabut, Ya.R. Kucherov, I.V. Savvanimova. "Nuclear product ratio for glow discharge in deuterium", PhysicsLettersA, 170, p.265, 1992.
2. Richard B. Firestone, Table of Isotopes, Eighth Edition, Vol.2, Appendix G-1, John Wiley & Sons, Inc., NewYork, 1996.
3. A.B. Karabut, Patent application 2412-221636.5002, Russia.
Return to the clickable list of items