Click to see the list of links
300) Preliminary Colorado2 report
Ludwik Kowalski; 6/28/2006
Department of Mathematical Sciences
Montclair State University, Upper Montclair, NJ, 07043
As some of the readers know, about one year ago I decided to devote some time and energy to a relatively simple experiment whose purpose was to either
confirm or to refute reality of excess heat in Mizuno-type cells (*1). That decision was influenced by two authors who had already confirmed reality of
such heat -- Eugene Mallove (*2) and Jean-Lois Naudin (*3). Their descriptions of experiments made me think that a Mizuno-type cell is an ideal device
for low-budget student-oriented investigations possible in many physics labs. As described in the unit #252, I was directly influenced by a report sent
to me by Pierre Clauzon from the Laboratoire d'Electrochimie Industrielle at Conservatoire National des Arts et Métiers, Paris (4*). He assured me,
in a private message, that a possibility of chemical origin of excess heat, in Mizuno-type cells, has been investigated -- and declared impossible -- by
a French chemist. That was a very important point; I am not qualified to deal with such issues.
In unit #252 I wrote: “. . . On the other hand, I anticipate problems with water condensation on the walls of the beaker, and with possible splashing,
above 200 W. Each of these two effects, if not accounted for, can contribute to an apparent excess heat.” Condensation turned out to be tolerable
because water condensing on the inner walls of the beaker releases as much heat per gram as absorbed to create steam in the first place. Significant
loss of water resulting from splashing was subsequently eliminated with drop reflectors. Units #253, 255, 256, 258 259 and 260, on this website, were
composed before I had a chance to see the Mizuno-type cell in action. That was the cell built by Scott Little, in Austin, Texas. Some of the things
I wrote were not clearly expressed. But that reflected the evolution of my thinking.
Work in Austin (Texas1 experiment) and subsequent work with Richard Slaughter in Boulder (Colorado1 experiment) did not reveal any excess heat. The setup
used in this experiment was described in the unit #261. The unit recognizes a very important suggestion made by Dennis Cravens -- a possibility that
excess heat is an artifact due to the presence of invisible droplets of electrolyte escaping with bubbles of oxygen and hydrogen. I wish this possibility
were taken by us more seriously and that some kind of a test were invented to determine the percentage of the electrolyte in the lost liquid. The
suggestion was ignored and we simply assumed that the escaping liquid was nothing but dry steam. Preoccupation with tiny droplets became an issue many
months later, when Colorado2 results were discussed at the restricted internet list for CMNS researchers. But I am jumping ahead of this little overview
Negative findings, contradicting the conclusion of (*4) were reported at the 12th International Cold Fusion Conference in Japan (*5). Positive findings,
confirming the conclusion of (*4), during the next sequence of experiments in Slaughter’s lab., were reported over the Internet several weeks
later (*6). They were discussed extensively at this list. To avoid confusion the following labels were introduced to identify recent and future Mizuno-type
experiments:
Paris1 (*4) French work done before the last conference in Japan
Colorado1 (* ) Work in Little’s lab before the last conference in Japan
Colorado2 (* ) Work in Saughter’s lab after the last conference in Japan
Paris2 (* ) A sequence of titration tests on the electrolyte used in Colorado2
Paris3 An anticipated new CNAM project in France
Colorado3 An anticipated new project in Slaughter’s lab.
Marseilles1 An anticipated new French project in Biberian’s lab
After analyzing Colorado2 data we decided to write a paper about our findings. I said that I will try to produce the first draft. The authors would be
Richard Slaughter, Pierre Paul Clauzon, Jean-Francois Fauvarque, Ludwik Kowalski, Gerard Jean-Michel Lalleve, and Scott Little. The idea was to focus on
experimental results, rather than on possible interpretations. The only electrochemist among us, Professor Fauvarque, would write an appendix showing that
the excess heat measured was orders of magnitude larger than what could possibly be contributed to chemical reactions. What follows, after the list of
references below, is the beginning of my draft. Do not confuse references with asterisks, which are for
this unit, with references for our paper. The paper references are included because our introduction refers to them.
*References:
*1) Ohmori and Mizuno "Strong Excess Energy Evolution, New Element Production, and Electromagnetic Wave And/Or Neutron Emission in the Light Water
Electrolysis with a Tungsten Cathode." presented at ICCF7,1997.
*2) E. Mallove in http://www.amasci.com/weird/anode.txt
*3) Jean-Lois Naudin's web site - “CFR project, a High Temperature Plasma Electrolysis based on the Tadahiko Mizuno work from the Hokkaido University
(Japan)” http://jlnlabs.imars.com/cfr/
*4) Jean-Francois Fauvarque, Pierre Paul Clauzon and Gerard Jean Michelle Lalleve. “Abnormal excess heat observed during Mizuno-type
experiments;” 2005. The report can be downloaded from the library at <http://www.lenr-canr.org>
*5) L. Kowalski et al. November, 2006: “New results and an ongoing excess heat controversy.” The report will be published in the proceedings
of the 12th International Conference on Cold Fusion.
*6) The URL is http://groups.google.com/group/cmns/ The name of the list is CMNS; Its archive, I believe, is not restricted to the list subscribers.
Is the Unexplained Heat Released During High-Voltage Electrolysis Truly
Anomalous?
Abstract:
Reality of unexplained excess heat in glow discharge plasma electrolysis, first described by Ohmori and Mizuno (1), has been confirmed in a
sequence of forty one tests. The results are described in terms of the coefficient of performance, COP, the ratio of the thermal energy released
in a cell over the electric energy supplied to it, during the same time. The mean COP, and the standard deviation, turned out to be 1.24 and 0.13,
respectively, as illustrated in Figure 1. The 24% of excess heat, in our setup, corresponded to about 30 kJ of thermal energy in five minutes (100 W).
We refer to excess heat as unexplained because we were not able to attribute it to known chemical reactions, as discussed in Appendix 2. The author of
that appendix is a French electrochemist, Dr. Jean-Fracois Fauvarque, from the Laboratoire d’Electrochimie Industriel, CNAM, Paris.
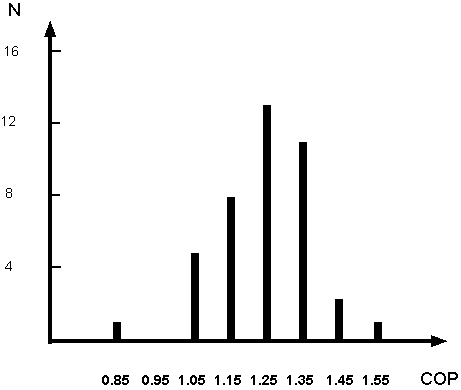
Figure 1 Distribution of COPs resulting from 41 tests performed at several differences of potential between 300 and 350 volts. No significant
effect of the voltage on the COP was observed in that region.
*******************************
Introduction:
The controversy surrounding excess heat is part of a broader controversy about the so-called “cold fusion.” The broader controversy
started to evolve in 1989 after two electrochemists, M. Fleischmann and S. Pons discovered a strange energy releasing process (2). Their hypothesis,
actually a guess, was that the unexplained heat was due to an exothermic nuclear process. Such processes are usually associated with emission of
neutrons, and with production of radioactive nuclei. The hypothesis was rejected when it became clear that neither radioactive nuclei nor neutrons
were produced in amounts commensurate with excess heat. If the unexplained heat, confirmed in many subsequent experiments, is real then it cannot
possibly be due to well known nuclear reactions. Fleischmann and Pons discovered excess heat in conventional electrolytic cells. Several years later
reality of unexplained thermal energy was discovered in high-voltage electrolytic cells (1), and in some non-electrolytic processes, for example,
when deuterium gas diffuses through palladium (3). Numerous experiments devoted to excess heat are described in (4). Critical reviews of early cold
fusion studies can be found in (5,6).
This paper focuses on measurements of excess heat similar to those initially described by Ohmori and Mizuno. Other aspects of high-voltage electrolysis,
such as investigation of products of nuclear reactions (7) and abnormal generation of hydrogen (8) were outside the scope of our investigation. In their
first high-voltage electrolysis experiment Ohmori and Mizuno reported that “the electrode became incandescent.“ Their COP was 2.6 and their
excess energy was generated at the rate of 183 W.
Excess heat generation was confirmed in several Japanese experiments, as described in (20, 21 and 8). In Europe reality of excess heat was confirmed
in experiments performed by: J.L. Naudin (9), by D. Cirillo et al. (10), and by J.F. Fauvarque et al.(11). All these studies confirmed reality of excess
heat. Scott Little (12), on the other hand, was not able to confirm reality of excess heat in a Mizuno-type experiment. Negative findings were also
published by L. Kowalski et al. (13). Their negative report, presented at the conference, was discussed by several participants, including Mizuno.
The discussion revealed that plasma in (12) and (13) was considerably different from that in (11). The investigation described here was undertaken to
resolve the controversy between (11) and (13). The main conclusion of (11) -- the over unity of COP -- has been confirmed, as illustrated in Figure 1.
Continuation of my draft is below the list of references.
References:
1) Ohmori and Mizuno "Strong Excess Energy Evolution, New Element Production, and Electromagnetic Wave And/Or Neutron Emission in the Light Water
Electrolysis with a Tungsten Cathode." presented at ICCF7,1997.
2) Fleischmann, M., S. Pons, and M. Hawkins, Electrochemically induced nuclear fusion of deuterium. J. Electroanal. Chem., 1989. 261: p. 301
and errata in Vol. 263.
3) Li, X.Z. et al. (2003) "Correlation between abnormal deuterium flux and heat flow in a D/Pd system." J. Phys. D: Appl.
Phys., 36, 3095
4) C. G. Beaudette, Excess Heat. Why Cold Fusion Research Prevailed. 2000, Concord, NH: Oak Grove Press (Infinite Energy, Distributor).
5) J.R. Huizenga, "Cold Fusion: The Scientific Fiasco of the Century". second ed. 1993, New York: Oxford University Press
6) E. Mallove, "Fire from ice", 1991, NY: John Wiley, pp. 246-248
7) T. Mizuno and Y. Toriyabe, Proceedings of ICCF12 (2005), Eleventh International
Conference on Condensed Matter Nuclear Science. 2004. Marseilles, France. The report can be downloaded from the library at www.lenr-canr.org
8) Tadahiko Mizuno, David. Y. Chung, F. Sesftel and Yoshiaki Aoki; “Generation of Heat and Products During Plasma Electrolysis;” Conference
on Condensed Matter Nuclear Science. 2004. Marseilles, France. The report can be downloaded from the library at www.lenr-canr.org
9) Jean-Lois Naudin's web site - “CFR project, a High Temperature Plasma Electrolysis based on the Tadahiko Mizuno work from the Hokkaido University
(Japan)” http://jlnlabs.imars.com/cfr/
10) D. Cirillo, A. Dattilo, V. Iorio, “Transmutation of metal to low energy in confined plasma in the water (electrochemical plasma
cell),” ,”. in Eleventh International Conference on Condensed Matter Nuclear Science. 2004. Marseilles, France. The report
can be downloaded from the library at <http://www.lenr-canr.org>
11) Jean-Francois Fauvarque, Pierre Paul Clauzon and Gerard Jean Michelle Lalleve. “Abnormal excess heat observed during Mizuno-type
experiments;” 2005. The report can be downloaded from the library at <http://www.lenr-canr.org>
12) Scott R. Little, H.E. Puthoff and M.E. Little, as reported in: http://www.earthtech.org/experiments/Inc-W/Mizuno.html
13) L. Kowalski et al. November, 2006: “New results and an ongoing excess heat controversy.” The report will be published in the proceedings
of the 12th International Conference on Cold Fusion.
14) E. M. Drobyshevskii, Y.A. Dunaev and S. I. Rozov, Sov. Phys. Tech. Phys., 18 (1973)
72.
15) V. M. Sokolov, Sov. Phys. Tech. Phys., 29 (1984) 1112
16) N. A. Reiter and S.P. Faile in www.geocities.com/spfaile/plasma/Plasma.html
17) J.L. Naudin in http://jlnlabs.imars.com/cfr/ape/apenrg.htm
18) E. Mallove in http://www.amasci.com/weird/anode.txt
(19) H. Korge, M. Laan and P. Paris; 1993 J. Phys. D: Appl. Phys. 26 231-236
20) T. Mizuno, T.Ohmori, T. Akimoto, and A. Takahashi. “Production of Heat During Plasma Electrolysis.” Jpn. J. Appl. Phys. A, 2000.
39: p. 6055. Downloadable from the library at <http://www.lenr-canr.org
21) T. Mizuno, T. Ohmori and T. Akimoto. “Generation of Heat and Products During Plasma Electrolysis,” in Tenth International
Conference on Cold Fusion. 2003. Cambridge, MA. Downloadable from the library at <http://www.lenr-canr.org>
* * * * * * * * * * * * * *
Experimental setup:
High-voltage electrolysis, also known as GDPE (glow discharge plasma electrolysis) takes place when the electric field near the cathode is
sufficiently high to ionize bubbles of hydrogen and oxygen created during the electrolysis (14,15). As in (11), our tests were performed in an open
cell with two electrodes, a tungsten cathode and a platinized titanium anode. The applied differences of potential were in the range between 300 and
350 volts while the currents were in the range between 2 and 3 amperes. Our cell had cylindrical geometry, as illustrated in Figure 2.
*************
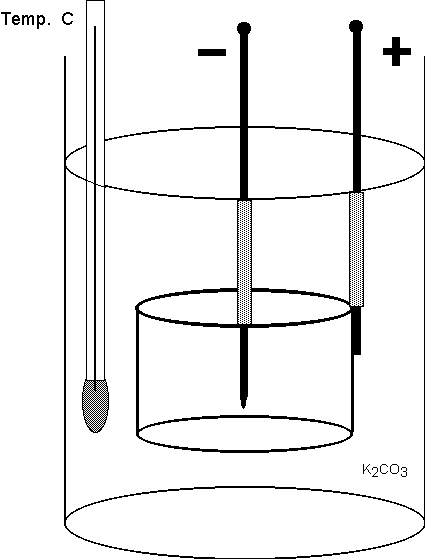
Figure 2 Simplified schematic diagram of the open cell. Holders on which the electrodes and the thermometer were mounted are not shown. Also not
shown are the ohmic heater, inserted into the electrolyte, and buffers designed to eliminate consequences of boiling splashes. The tungsten rod was
surrounded by a ceramic tube (dotted pattern) whose purpose was to confine the glow discharge to the lower part of the cathode.
**************
The electrolyte was the 0.2 M potassium carbonate, K2CO3 in distilled water. The 0.02 M
concentration was also tried; the effects were not noticeably different from those observed at 0.2 M. Likewise no noticeable differences were observed
when the diameter of our cylindrical anode was changed from 4.4 cm (platinized Ti) and 8 cm (platinized Nb). Our tungsten cathodes were standard welding
rods, purchased in a welding supply store. Two kinds of rods were tried: with 2% of thorium and without thorium. No significant difference between them
was observed. The diameter of the cathode, on the other hand, had an effect on the voltage at which the plasma column was formed; thinner cathodes ignited
at lower voltages than thicker cathodes. This observation is consistent with what has been reported in (16).
Excess heat was generated when the electrolyte was boiling and when the lower end of the cathode (below the ceramic tube) was surrounded by a deep orange
column of glowing vapor. Our protocol was similar to that described by Naudin (17) and Mallove (18). The voltage was increased to the desired value slowly,
for example, to 300 V in one to several minutes. During that time the current increased and then dropped down progressively, for example, to 2 A. It is
reasonable to explain this in terms of the resistance of the plasma column surrounding the cathode. The current starts to decrease when the glow discharge
is ignited. This can be interpreted by assuming that the column of the plasma becomes thicker at higher voltages and that its resistance increases with
the thickness. A typical experiment lasts several minutes, as in (11). Depending on the voltage, one can perform 5 to 10 consecutive tests before the
tungsten cathode is eroded.
Measuring electric energy:
A DC power supply was used as the source of electric energy. A set of two electrolytic capacitors (3100 mF and 450 V each) was connected in parallel
with the cell. That was sufficient to keep the voltage constant, as verified with an oscilloscope. The electric current, however, turned out to fluctuate
rapidly due to the random nature of the glow discharge. Electric energy Ee, supplied to the setup during a test, was initially measured by the method of
fast samplings. This was accomplished by using a computer-based data acquisition system. The rate of sampling was 100 per second. The value of Ee was then
calculated as the sum of v(t)*i(t)*dt, where the dt=0.01 seconds is a time between sampling while the v(t) and i(t) are instantaneous values of the
voltage and amperage.
The second method of measuring the electric energy consisted of reading the Ee from a digital kWh-meter, U-390 (U stands for Unigore). That commercial
instrument was designed to deal with sinusoidal and non-sinusoidal inputs. As expected, the discrepancy between the two methods were less than two
percents. Independent digital voltmeter and digital ammeter were also used to visually estimate the mean values of v(t) and i(t) during consecutive
minutes. Visual averaging is less reliable than fast electronic averaging but discrepancies between the last method and the first two were usually less
than several percents. Unfortunately, our computer-based system became disabled due to an accidental short. For that reason about 80% of measurements
of Ee were made with the digital kWh-meter. We believe that these measurements of Ee were accurate to within two percents. That confidence is based on
the random nature of plasma current fluctuations. Fluctuations that are not random can lead, under certain conditions, to significant systematic errors,
as illustrated in Appendix-1.
According to technical specifications the U-390 is reliable even when the current is non-sinusoidal. Our thermal calibration of the instrument confirmed
that claim. The calibration was performed by connecting the power supply in series with an electrolytic cell (beaker #1) and with an ohmic heater of
about 100 ohms, immersed in the beaker #2. That second beaker contained boiling water. The only function of the electrolytic cell, in the calibration
experiment, was to modulate the electric current randomly. The electric energy, Ee, delivered to the heating resistor in about 20 minutes, was measure
with the U-390 kWh-meter. The result was compared with thermal energy, Et, released in the beaker at the same time. The two energies turned out to differ
by only 0.43%. Measurements of thermal energy are described in the next section.
Such result would be impossible if measurements of Ee were associated with large systematic errors. It is important to emphasize that the current flowing
through the ohmic resistor, during the thermal calibration of U-390, was essentially of the same non-sinusoidal kind as the current flowing through the
electrolytic cell when the COPs were measured. Two independent calibrations of our kWh-meter (by measuring thermal energy and by using the fast
computer-based data acquisition setup) confirmed that the instrument is indeed reliable, even when the current is not sinusoidal.
An additional confirmation of the reliability of the U-390 instrument came from the comparison of its readings with the kWh received by the power supply
at the a.c. side, as measured with another kWh instrument (DMMetering, model DRM75A). The two energies, measured at the same time,
differed by ~ 3%. That difference was more or less consistent with the amount of heat dissipated inside of our simple home-made power supply. In order
to bring the mean COP to unity (from 1.24) the true Ee would have to exceed the U-390 readings by 24%. This would conflict with the kWh measured at the
a.c side of the rectifier.
Measuring thermal energy:
Thermal energy, Et, released in an open cell during a test, consists of two parts: Ev, used to evaporate water, and Ec, escaping through conduction,
convection and radiation. The Ev during the electrolysis was calculated from the evaporated mass, m; the Ev is simply L*m, where L is the latent heat of
evaporation, 2260 J/g.
The same approach was used to find the Ev in the tests with the ohmic heater, for example, in the beaker #2, during the calibration of the U-390 kWh
meter.
The non-evaporative losses of thermal energy, Ec, were calculated from the Ee and Ev measured when boiling was due the ohmic heater, that is when
Ec=Ee-Ev. The heater was connected to the 110 volts a.c. line. Electric energy received by the heater was measured with two kWh-meters: U-390 and a
much less sophisticated ??? (designed for sinusoidal currents only). No significant difference between the readings of these two kWh-meters was observed.
The cell shown in Figure 3 was standing on a digital electronic scale. In that way the mass, m, lost through evaporation, during each test, or during
calibrations, could be measured with the accuracy better than 1%. If m=10 grams in t=60s then the thermal evaporative power is
Pv=Ev/t=377 W. Switching from energies to powers is convenient because duration's of experiments are not identical. In
what follows the Pe=Ee/t will be called electric power and the Pc=Ec/t will be called the non-evaporative thermal power. The coefficient of performance is
COP = (Ev+Ec)/Ee = (Pv+Pc)/Pe
Note that under identical boiling and mixing conditions the Pc during ohmic heating is expected to be essentially the same as the Pc during plasma
electrolysis. For our two-liter beaker (our electrolytic cell) the values of Pc turned out to change linearly from about 50W to 80W when the Pe changed
from 300W to 850W. The values of Pc were measured before and after the electrolysis experiments.
Experimental results
In a typical GDPE experiment, lasting 300 s, the Pe and Pc were close to 300 W and 50 W, respectively. About 40 grams of water was lost during such
experiment. That gives Ev=90400 J, Pv= 301 W and COP=1.17. The values of COP fluctuated slightly from one experiment to another. The mean COP, and the
standard deviation, from our forty one tests, turned out to be 1.24 and 0.13, respectively, as illustrated in Figure 1.
Experiments were performed at potentials between 300 V and 350 V. Contrary to what was reported in (11) the voltage had no significant effect on the COP.
Discussion
The results were discussed on the restricted Internet list for the CMNS researchers. The acronym stands for Condense Matter Nuclear Science -- it is a
new name for what used to be called cold fusion. In our opinion the word “Nuclear” is premature. As far as we know, no one was able to show
that the rate of accumulation of nuclear reaction products, in Mizuno-type cells, is close to one atom per several MeV, of excess energy, as in many
well known nuclear reactions. Additional experiments will be necessary to clarify a mechanism, or mechanisms, through which excess heat is produced. The
only statement we can make, at this time, is that well known chemical reactions cannot possibly be responsible for the excess heat measured. That topic
is discussed in the Appendix 2, written by a French electrochemist, Jean Francois Fauvarque.
To illustrate difficulties encountered in trying to attribute execs heat to chemical fuels let us consider tungsten. In one experiment, lasting ten minute,
the measured excess heat was 60 kJ (at the rate of 100 W). During that time about 1.3 grams of tungsten was lost by the cathode (diameter 2.4 mm). According
to (1) the loss is due to melting; it cannot be due to heat-producing oxidation because negative ions containing oxygen are repelled by the cathode, as
explained in the Appendix 2. But suppose that one ignores this fact, as done in (1), and assumes that all excess heat comes from formation of
H2WO4. It is easy to show that if 60 kJ of thermal energy is due to consumption of 1.3 grams
tungsten then each atom contributes 88 eV of the measured excess. In our experiments about 50% of tungsten removed from the cathode was recovered as metallic
particles at the bottom of the cell. That means that the number of reacting atoms of tungsten was one half of the 1.3 grams.
Taking this experimental fact under consideration the rate of generation of energy becomes 176 eV per atom. This is 44 times larger than what is
expected -- oxidation of one mole of tungsten, with subsequent formation of H2WO4,
generates 220.84 + 179 = 380 kJ of heat. In other word, attributing our measured excess heat to the oxidation of tungsten would conflict with what is
known about the 2W+3O2=2WO3 and WO3+H
2O= H2WO4.reactions. This has already been emphasized by Mizuno et
al. (1). The only possible exothermic reaction, according to Appendix 2, is decomposition of water. That reaction contributes only 4.3% to the excess
heat measured. To exclude its contribution the reported value of the COP, 1.24, must be replaced by 1.21. Other possible reactions, discussed in the
Appendix 2, are endothermic and their combined contributions to the COP was estimated as -5%. In other words, the net effect of well known reactions,
on the value of the COP, is essentially negligible.
Can the over unity of the COP be due to an erroneous assumption that the Pc measured during the electrolysis was the same that the Pc measured when the
current was flowing through the ohmic heater? Suppose that a layer of foam is formed on the surface during the electrolysis but not when the current
flows through the ohmic heater immersed into the electrolyte. In that case, as recognized by Michel Julian, convectional losses used to calculate the
COP would be exaggerated leading to an overestimation of the COP. We have two reasons to rule out this possibility. The first reason is that no significant
differences between surfaces was observed during our experiments. The second reason is based on a control experiment performed to investigate this issue.
In that control experiment the electrolyte was in dewar rather than in a much wider beaker. This reduced the Pc but the values of COP was not significantly
lower than 1.24.
Can the over unity of the COP be due to an error in the mass m used to calculate thermal losses. We assumption that the liquid lost during an experiment
was nothing but pure vapor. But suppose that this was not correct. Suppose that 25% of the lost mass, m, consisted of escaping droplets. In that case
our Pv, calculated from the 2260*m, would be strongly exaggerated. An exaggerated Pv, in turn, would create an illusion that COP is larger than unity.
Emission of visible drops has often been observed during our experiments. The mass of visible drops was estimated on the basis their volumes. In some
cases a paper towel was used to collect drops and to measure their combined masses. The typical estimated mass was less than one gram per test. That was
much smaller than the total lost mass m, typically 40 grams per test. On that basis the effect of visible drops on the COP was estimated as less than 2.5%.
But what about the much smaller, invisible droplets? That issue was not addressed during the experiments. Most of such invisible droplets are likely to
evaporate before being intercepted by the paper towel. The effect of tiny droplets, however, was assessed after experiments. . . . [WORK IN PROGRESS]
Can excess heat measured be attributed to some kind of energy accumulation process? To answer this question we considered a possibility that our cell
acted as a rechargeable electric battery. In a control test the cell, after being connected to the power supply for several hours, was suddenly
disconnected and discharged through a resistor. [WORK IN PROGRESS] Another possibility considered was short-time storages and releases of thermal
energy. That hypothesis was ruled out the basis of high reproducibility. The mean COP of 1.24, and the standard deviation of 0.13, from 41 tests, would
not be possible if such mechanism played a significant role. Furthermore, significant random thermal accumulations and releases would be associated with
significant temperature fluctuations during consecutive tests. The actually observed temperature fluctuations, about one degree or so, probably contributed
to the size of the standard deviation.
Conclusion:
The overall conclusion is that the GDPE thermal-excess energy, discovered in (1), and confirmed by other investigators (9, 10 and 11), seems to be
real. Generation of excess heat, at the 0.1 kW level, turned out to be reproducible. The origin of that energy is not clear to us. Can several cells be
used in a battery generating excess heat at a much higher rate? Not having an accepted theory one must rely on empirical investigations. Systematic studies
of effects of various parameters (size, composition, and geometry), on the performance of Mizuno-type cells, seem to be warranted.
Can excess heat be attributed to a well known nuclear reaction, such as D-D fusion? The answer to this question must be negative. Familiar nuclear reactions
generate radioactive byproducts. A thermonuclear D-D reaction, for example, generating excess heat at the rate of 0.1 kW, for three hours would produce
about 4*1019 neutrons. That would be sufficient to create radioactive isotopes in many objects near the cell. A Geiger
counter we used, however, showed that the level of radioactivity, near the cell, was not higher than natural background. The time of three hours, by the
way, is used because that was not very different from the total duration of our 41 experiments. Speculations about the origin of excess heat are less
important, at this stage, than establishing its existence.
Appendix1: Measuring electric energy by sampling.
The electric energy E, delivered to a cell, is the integral (over a test duration) of dE = i(t)*v(t)*dt, where i(t) and v(t) are instantaneous values
of the current and potential, respectively, while dt is a very short time interval. The glow discharge current is known to fluctuate randomly. This was
confirmed by using an oscilloscope. Fluctuations of i(t) were not associated with significant fluctuations of v(t) because a large electrolytic capacitor
(0.001F and 500 V) was connected between the cell electrodes. It fact, the v(t) was essentially constant during each test. As previously indicated,
digitized samples of v(t) and i(t) were recorded by the data acquisition board controlled by a computer.
Suppose that the sampling frequency is much lower than some frequencies contributing to the shape of the current waveform. Can this lead to a systematic
error in a measured value of the electric energy delivered to the cell? The answer is negative, unless the current fluctuations are not random. To justify
this answer consider a current waveform shown in Figure 3. It has been generated by using random numbers (from a uniform distribution between 0 and 2). The
time intervals between consecutive current changes were 0.1 ms, as indicated. It is clear that the spectral composition of that waveform contains
frequencies higher than 10 kHz. The mean current, over a long period of time, is 1 A, by design.
Suppose that the shape of this waveform must be determined by sampling. The rate of sampling would have to be considerably higher than 10 kHz , for
example, at least two or three measurements during every 0.1 ms, depending on the desired accuracy. The dark circles show the waveform one would obtain
if the sampling rate were only 2 kHz. Connecting the dark points with straight segments one gets a shape that is quite different from the real shape of
the waveform. But the situation becomes dramatically different when the purpose of sampling is to determine the mean current over a long time interval,
for example between 0 an 20 seconds. In that case the mean value from the two waveforms would be practically identical. This fact was numerically
verified by using a computer code. The six mean currents, obtained by executing the code six times (six different waveforms) were: 1.000, 0.999, 0.993,
1.001, 0.992 and 1.004 A.
In other words, the sampling frequency necessary to determine the mean current can be much lower than what would be necessary to determine the shape of
the signal. The only requirement, to obtain a reliable mean value, is to gather a sufficiently large number of unbiased samples during an experiment.
This conclusion is intuitively obvious for any random waveform. The situation, however, can be different for a periodic waveform, as illustrated in
Figure 4. In that example the sampling interval -- 1 ms -- is the same as the period of repetition. The apparent mean current would thus be 0.2 A; that
is several times smaller than the true mean current.
Note that the apparent mean current of 0.2 A would occur only at sampling frequencies of 1 kHz, 0.5 kHz, 0.25 kHz, 0.125 kHz, etc. At all other sampling
frequencies the apparent and the true means would be nearly identical, provided the sampling interval is negligibly small in comparison with the duration
of the waveform. In other words, an error due to a poor choice of sampling frequency, for a periodic waveform, is possible but not very likely. To
eliminate possible systematic errors periodic waveforms must be sampled at randomly distributed intervals (rather than at equal intervals, as in Figures
3 and 4). Using consecutive sampling at two different frequencies, such as 13 kHz and 17 kHz, and showing that the means are nearly identical, would be
a good indication that a sampling error did not occur.
Someone who also built a Mizuno-type cell examined the v(t) waveform with a 20 MHz digital oscilloscope. The examination revealed presence of pulses
whose duration's were several microseconds. These were said to be similar to the well known Trichel pulses in corona discharge (19). Is it possible that
presence of such pulses may lead to an underestimation of the Ee, and consequently, an overestimation of the COP? To answer this question, in the context
of sampling, one would have to analyze what happens when a sample is collected. We simply assumed that an instantaneous value of voltage, captured during
several milliseconds, is already an average based on what happens at the level of microseconds, nanoseconds and picoseconds. It is unlikely that ultra-fast
pulses would lead to nearly identical systematic errors in different kinds of kWh meters used in this investigation. Same observation can be made about
possible effects of electromagnetic interference.
Appendix 2:
Contributions of possible chemical reactions to excess heat.
Appendix is going to be sent to me, probably in the middle of July. I hope it will provide ammunition to argue against chemical origin of excess heat,
and against presence of the electrolyte in the escaping steam. Can a battery-like effect be responsible for generation of excess heat at the rate of
about 0.1 kW? I hope that this question will also be answered in the appendix written by the author, an electrochemistry professor in Paris.
Click to see the list of links