Click to see the list of links
327) Oriani’s effect in Phase 2
Ludwik Kowalski; 5/2/2007
Department of Mathematical Sciences
Montclair State University, Upper Montclair, NJ, 07043
* * * * * * * * * * * * * * * * * * * * * * * * * * * * * *
1) Introduction:
This unit is continuation of what was in unit #326. In what follows I will assume that the reader is familiar with the content of units #320 and #326. About a
week ago I asked myself about what to do next. The idea to abandon TGP work did come to my mind. But that would not be consistent with my goal -- to reach a
clear positive or negative conclusion about the SPAWAR claim. The only conclusion I reached so far is that prominent SPAWAR pits cannot possibly be attributed to
alpha particles, or lighter projectiles. That is only a small fraction of pits produced during the electrolysis. Oriani claims that some smaller pits are tracks
of nuclear particles. He told me that nineteen consecutive experiments convinced him that a nuclear effect is induced during the electrolysis. Several days ago
he had only seventeen results, as shown in the table below.
That table was posted on the private list for CMNS researchers. Column A shows the experiment number and column B shows which cell was used. Column C shows the
current or currents (in mA) used in the experiment. Column D is the duration of the electrolysis, in hours. Columns E and F show track densities. The first
track density (column E) refers to the CR-39 surface that was facing the mylar and the electrolyte The second track density (column F) refers to tracks on the
opposite side of the CR-39 chip. The area, on each side of the chip, over which tracks were counted was close to 10 cm^2. Thus numbers in columns E and F must
be multiplied by 10 in order to estimate the actual number of counts on each side of the CR-39 chip. According to Oriani, tracks are often clustered; the numbers
in columns E and F refer to mean track densities.
The first eleven experiments were made by using the CR-39 in which the mean background density was 26 tr/cm^2 (st.dev. 12). The last six experiments were performed
by using the CR-39 in which the mean background density was 12 tr/cm^2 (st.dev. 6). The last column, G, shows the signal to noise ratio -- ratios of numbers from
columns E and F divided by mean background densities. A symbols cb indicates that the surface was coated by a layer of blue plastic that stops alpha particles of up to
10 MeV. The symbol D (experiment 15 and 17) indicated that a small container with heavy water was located below the cell and the detector. In experiment #3 the chip
was lost before the actual counting. The >100 and >100 are estimates based on preliminary quick examinations.
A  B      C           D       E       F           G

         mA          hrs   tr/cm^2  tr/cm^2   sign/noise

1  S  .2 to 25       168     209     163     8.0,     6.3

2  S  .1 to 45       120     144     120      5.5,    4.6

3  S  12,41,100      101.5  >100    >100     >3.8,   >3.8

4  S  70,117,143      67     162     96       6.2,    6.7

5  S    30,75         96     267     289     10.2,   11.2

6  S     50           97     75      39       2.9,    1.5

7  S  5,10,25,50      96.5   151     75       5.8,    2.8

8  S  10,25,75,100    94     120     81       4.6,    3.1

9  S    300           65(?)  48      42(cb)   1.8,    1.6

10 B   10,25          98     74      22(cb)   2.8,    0.8

11 S   12,28          97     234     40(cb)   9.0,    1.5


12 S      20          95     35(cb)  78       2.9,    6.5

13 B      27          95     --(cb)  778       *,    64.8

14 S      20          94     43      104      3.6,    8.7

15 B      19          94     97      323(D)   8.1,   26.8

16 S      40          94     26(cb)  87       2.2,    7.2

17 B      39          94     264     200(D)  22.0,   16.7
These results are really impressive. After talking with Richard on the phone I decided to follow his new protocol in order to obtain similar results. Following
Oriani’s footsteps I will again use a PACA (protected against chemical corrosion) CR-39 detector. Note that three previous attempts to use these detectors yielded
negative results. Our first PACA detector was used in the SPAWAR electrolyte, our second PACA detector was used in Oriani’s electrolyte, as described in the
unit #320. The third experiment was described in unit #326. Unfortunately, due to an error, the Li2SO4 electrolyte, used in the third experiment, was about ten
times more concentrated than Oriani’s electrolyte. That might be a reason for failure to replicate Richard’s results. Another reason for the failure might have
to with the small size (only 0.9 cm^2) of our CR-39 detectors located below the mylar inside the cell tube.
Time zero; starting the experiment (13:00, May 1, 2007):
The initial concentration of the electrolyte is the same as in Oriani’s cells (2.0 grams of Li2SO4 in 100 cc of distilled H2O). I am using a 3 by 3 cm CR-39 chip
that Richard sent me. The current is 41 mA; it is kept constant with the TL317T operational amplifier, as described in the unit #319. The potential difference on
the cell is 6 volts. I know from experience that fluctuations of the cell current are small when a constant difference of potential is applied to it. That is why
I think that using the TL317T is not essential in this experiment. I am using the operational amplifier because I have it. The cell has been operating for
three hours.
Time=22 hrs (11:00, May 2, 2007):
Oriani suggested that I stop adding water to compensate for losses. He allowed the concentration of the electrolyte to increase during each experiment. The rate at
which the level of the electrolyte is going down is not high enough to reach the anode in four days. The inner diameter of the cell is close to 16 mm.
Time=32 hrs (21:00, May 2, 2007)
All is stable. Let me describe the control experiment, also in progress since yesterday. The second large CR-39 chip, sent to me by Richard, has been squeezed
between two O-rings far away from any electrolytic cell. The blue protective cover has not been removed from that CR-39 chip. I just want to have experimental
evidence that pressure alone cannot be responsible for clusters of pits on both CR-39 surfaces. The control experiment O-rings are pressed toward each other by
two flat wooden plates (using four small bolts with nuts). Both large chips will be etched at the same time in the same solution. I forgot to mention that one
little corner (about 2 mm^2) of my experimental chip has been exposed to alpha particles from the Am-241 source. That will allow me to compare sizes of pits,
after identical etching conditions.
Time=45 hrs (10:00, May 3, 2007)
I noticed that the the cell potential is no longer 5.96 V; it is 5.86. V. At least part of this is likely to be due to changes in the room temperature (probably
by no more than 5 C). But this is also consistent with the fact that the concentration of the electrolyte (ion density) increases. The potential would not change
if water was added to keep the concentration constant. The current is constant because I am using the TL317T stabilizer. Otherwise the current would go up and
I would have to lower the potential, to bring the current back to 41 mA. That is the advantage of the stabilizer. But such advantage would be only important
if keeping the current at exactly the same value were important. Oriani’s data (see the table above) seem to indicate that the effect does not depend on the
current. The cell potential is nothing else but I*R, where R is its electrical resistance, for a given ion density.
Time=53 hrs (18:00, May 3, 2007)
The level of the electrolyte keeps going down and the cell potential decreases; it is 5.75 V now.
This morning, while cleaning my digital desktop I discovered a piece of text that was composed before Oriani’s table (see above) was posted. I simply forgot about this
draft; it should have been appanded to unit #326. It describes control experiments performed after my unsuccessful attempt to replicate Richard’s results with a small
CR-39 chip. Note that in the experiment described in unit #326 only mylar was squeezed between the two O-rings sent to me by Oriani. That CR-39 chip was not squeezed,
it was resting on a solid support, about 2 mm below the mylar film. I wrote:
“After learning about my negative results, Oriani asked me to apply the CR-39 to his O-rings for 4 days. He also asked me to take the CR-39 that was
below his mylar (in the experiment described in unit #326) and etch it again. After four days the three chips that were in contact with O-rings and the previously
etched chip were etched for 5.75 hours.
(a) Chip that had 7 and 4 tracks after 6 hours of etching, had 14 and 7 tracks after additional etching. I think that this is not significant because of the frequent
“count-or-not-to-count” dilemma.
(b) Chip #1 (2 cm by 0.5 cm) applied to O-rings; 8 pits on one side, 5 on the other.
(c) Chip #2 (2 cm by 0.5 cm) applied to O-rings; 3 pits on one side, 6 on the other.
(d) Chip #3 (2 cm by 0.5 cm) applied to O-rings; 8 pits on one side, 6 on the other.
(e) Chip #4 (2 cm by 0.5 cm) blank; 2 pits on one side, 4 on the other side.
In other words, additional etching did not reveal more tracks than the first etching. In all cases there were nothing but usual background. These results convinced
me that Oriani’s was correct in claiming that O-rings were not contaminated by something alpha-radioactive.”
Time=58 hrs (23:00, May 3, 2007)
About 25% of water has been lost (electrolysis + evaporation), The cell potential is 5.65 V.
Time=68 hrs (9:00, May 4, 2007)
The cell potential is back to 5.86 V. That is not what I expected. The current remains the same as it was at time zero.
Time=76 hrs (17:00, May 4, 2007)
The cell potential is 5.54 V. The current remains the same as it was at time zero. I suspect that presence or absence of a large bubble, just below the
anode, is responsible for fluctuations of the resistance of the cell. Bubbles are sometimes grow slowly below the anode, before escaping. I did not
pay attention to this before.
Time=90 hrs (7:00, May 5, 2007)
The cell potential is 5.56 V.
Time=95 hrs (12:00, May 5, 2007)
The cell potential is 5.38 V. In one hour it will be four days. Instead of finishing at that time I plan to do the following.
(a) Disconnect the current stabilizer and collect data on the mA versus volts.
(b) Add water, to find our exactly how much was lost in four days.
(c) Collect data on current versus volts for the original concentration.
(d) Restart the electrolysis at higher current, for example 100 mA, till tomorrow.
(e) Etch both CR-39, post-electrolysis and control.
What else is worth doing? I will examine the chips next week.
Time=97 hrs (14:00, May 5, 2007)
The cell potential is 5.57 V. I am going to perform a, b, and c, as described above.
The amount of water lost in 4 days was about 2.75 cc. Taking the Volts-Amps data showed that things are not simple. For some reason the curve seem to be nearly
the same at both concentrations. I am not sure because of the hysteresis effect -- coming to 10 V from below does not give the same current as coming to it from
above. I do not want to deal with this; it is not my area. Roughly the R is about 90 ohms. But this seems to depend on many factors. Fortunately, it does not
matter. I will keep the current more or less constant by manually adjusting the power source voltage.
Time=~0.5 hrs (14:30, May 5, 2007)
All seems to be going on smoothly. I=160 mA at 12.5 V
Time=2 hrs, 16:00; 5/5/07
All is fine, only small corrections of voltage (up to about 10%) have to be made from time to time. If I do not make them then the current fluctuates slightly.
But this is OK; Oriani does not claim that the effect occurs at specific currents. But he said that the experiment with I=300 mA did not produce good results.
Recalling this, I decided to lower the current. At t=2 hrs the potential difference was reduced to 8.10 volts and the current became 80 mA. This is only two
times larger than the current I used in the first 4 days.
Time=6 hrs, 20:00; 5/5/07
Current 80 mA, potential 8.02 Volts.
Time=18 hrs, 8:00; 5/6/27
Current 85 mA, potential 8.3 Volts. I will bring the current back to 80 mA now. The increase of current was qualitatively consistent with a significant loss
of water, about 20% or so.
The increase of current was qualitatively consistent with a significant loss of water, about 20% or so. This morning I informed the CMNS list that my experiment will
end this afternoon. In that message I asked for advice on what else should be done before this to maximize the amount of information. Here is a reply from Scott Little.
My only suggestion is that you take care to handle the CR-39 from this experiment very gently. It is surprisingly easy to make tiny scratches in the
surface of CR-39 and scratches will often produce pits upon etching. We will be starting our version of this same experiment early next week.
That is great; nothing is better than a situation in which several laboratories are performing the same experiment. That is the only way to find hidden truth, and to
validate a scientific claim. Hidden truth about “cold fusion” does not depend on our wishes. It exists and scientists try to discover it. Then they try to validate what
has been discovered, according to well established rules. I think we are following these rules correctly. We are not pseudo scientists, as many believe. We know
how to distinguish wishful thinking from objective reality. The rules of the game have been established long time ago and most of us are simply following them.
Pseudo scientists are those who refuse to learn about current investigations conducted by qualified researchers, not those who are trying
to either confirm or refute various claims.
Why did I put quotation marks around cold fusion? Because we have no evidence what kind of nuclear process we are trying to validate. Fusion of two independent atomic
nuclei is only one mechanism. That is why the term cold fusion is now often replaced by CMNS (condense matter nuclear science), LENR (low energy nuclear reactions) and
CANR (chemically assisted nuclear reactions). My preference is CANR because the central issue is, as it has been since 1989, reality of a strong nuclear process
triggered by a much less strong chemical process. If reality of such process is established then scientists will try to understand it. I would not be surprised to
learn that there are different “cold fusion” phenomena. Replicability is essential at this stage of the game. That is why I am so happy that Scott and Marissa are
also going to perform the same Oriani’s experiment.
Time=20.5 hrs, 10:30; 5/6/07
The current is still 80 mA, potential 7.96 Volts.
Time=24 hrs, 14:00; 5/6/07
The current is 80 mA, the potential is 7.95 Volts. The electrolysis will be ended in two hours.
Time=26 hours, End of electrolysis.
The current was 80 mA, the potential was 7.97 V. The total electrolysis time was four days at 41 mA, one day at 80 mA and two hours at 160 mA.
= = = = = = = = = = = = = = = = = = = = = = = = = = =
1) Etching of two large CR-39 chip (post-electrolysis and control) started at 16:15. Before etching the corner of the control chip was irradiated with alpha
particles from my Am-241 source. Two scratches were made near that corner, on the same side that was exposed to alphas. Following Scott’s advice, I skipped the
cleaning with the toothbrush step. I know it does not create scratches but . . .
2) Etching (in NaOH 6.25 N) took 6 hours. The temperature fluctuated between 73 and 75 C; most of the time it was at 74 C. Tomorrow I will go to school and examin
the chips.
3) The first thing I did was to count tracks on the control chip. My fear was that I might discover them. That would indicate that an artifact (mechanical pressure)
is responsible for Oriani’s successes. There were twenty of them, he told me today. I was afraid because CR-39 chips are usually not used under pressure, just as they
are normally not used in electrolytes. The result was reassuring. I counted 8 pits on one side of the chip and 16 on the other. These numbers were highly inflated
because I was very very generous in deciding what to count as pits. By my usual criterion the count would be 3 and 6. The chip area was 9 cm^2 and this amounts to
2 tr/cm^2 or 0.5 tr/cm^2. No matter how I count the result is much lower than the expected background (mean=12 and st.dev.=6).
On that basis I decided to start another experiment; what was the control chip became the experimental chip. The new experiment started at 18:15 today (5/7/07).
Marissa Little also received large CR-39 chips from Oriani, plus the O-rings and mylar. These were used by him up to last Saturday morning. They also started the
experiment today. I am using the same cell, the same O-rings, the same mylar, and the same electrolyte as in the previous experiment. The current is again 41 mA; the
cell potential is 6 V (the power supply potential is 15 V. Will the results will be equally spectacular? I will probably know next Monday.
4) After examining the control chip I started to examine the post-electrolysis chip.
= = = = = = = = = = = = = =
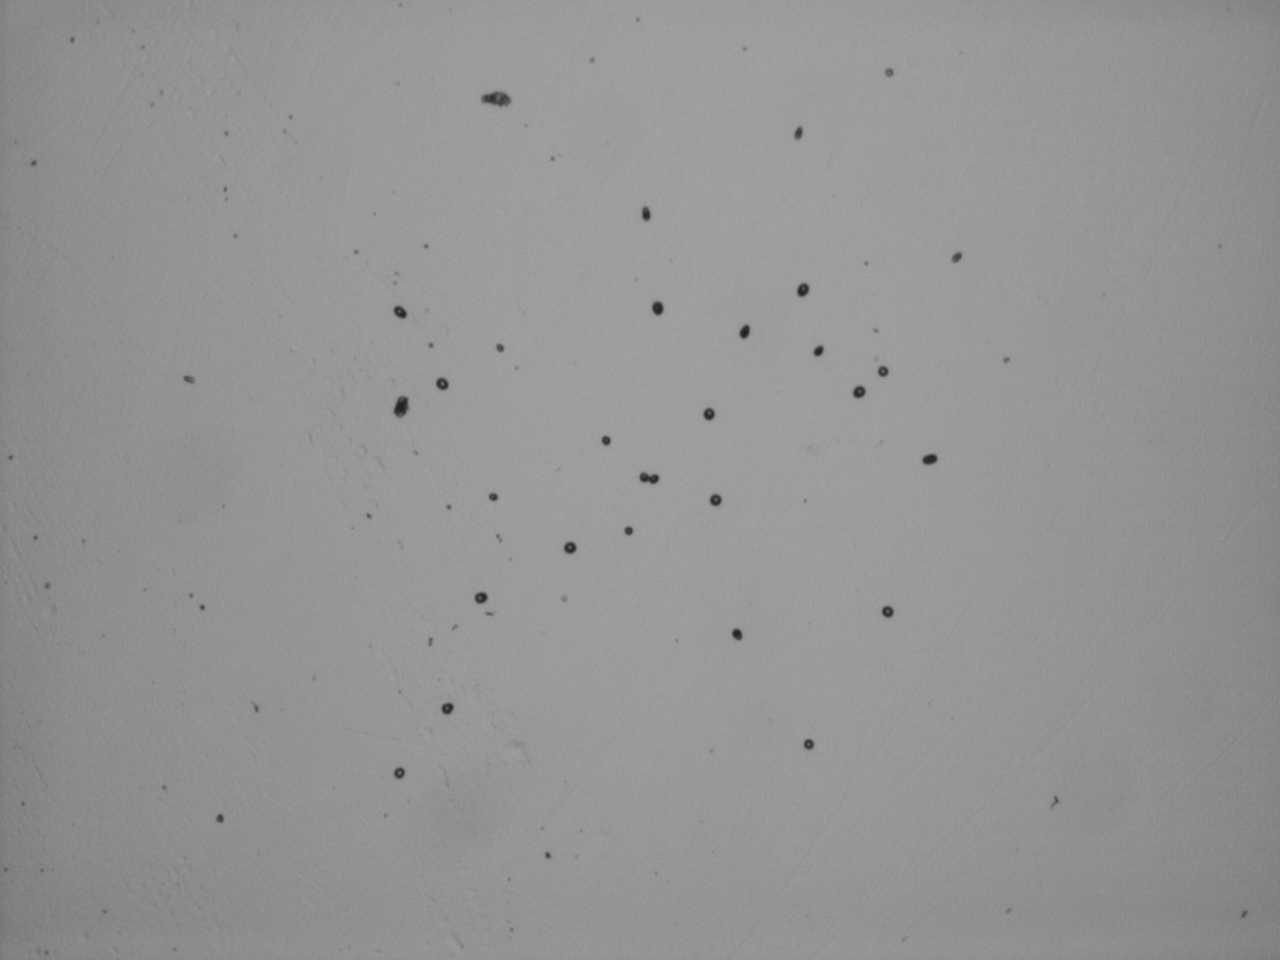
Figure 1
A small cluster of tracks. Magnification 40. The photographed area is about 1.3 mm by 1.0 mm
= = = = = = = = = = = = = = = = = = = = = = = = = = = =
The figure above is a cluster of 29 tracks which could be due to alpha particles, and several smaller tracks that can be due to protons. What is remarkable is that
the cluster is surround by fields without tracks. The mean track density, over the area of Figure 1 is close to 23 tr/mm^2. This is 2300 tr/cm^2. The track density in the
surrounding area is only about 6 tr/cm^2. The next figure shows tracks due to alpha particles from the Am-241 source, under identical etching conditions.
= = = = = = = = = = = = = =
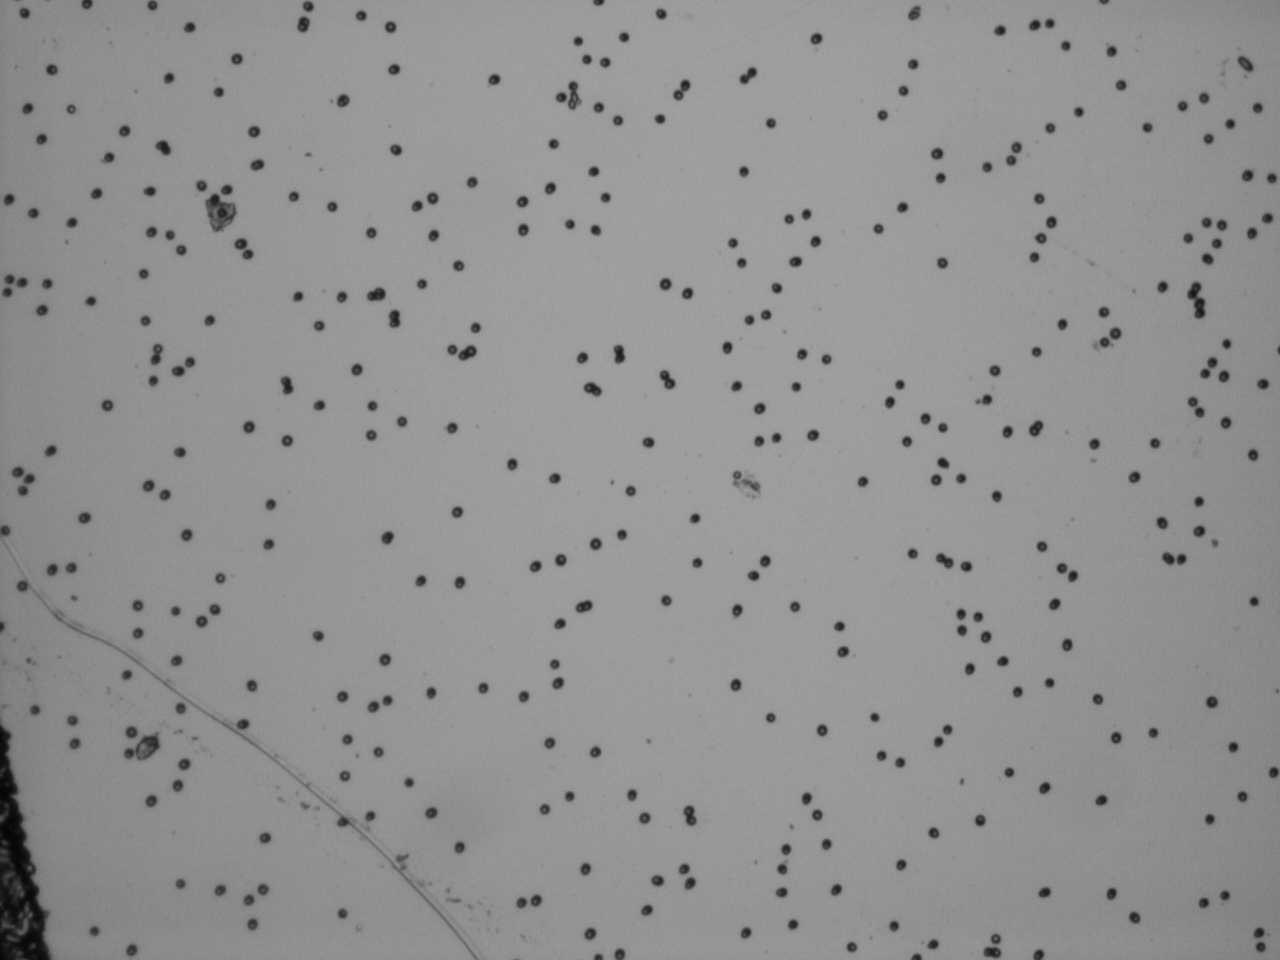
Figure 2
Tracks due to alpha particles. Magnification 40. The photographed area is about 1.3 by 1.0 mm
= = = = = = = = = = = = = = = = = = = = = = = = = = = =
A much larger cluster is shown in Figure 3 and Figure 4. In fact, tracks in the lower part of Figure 4 also appear in the upper part of Figure 3. The area of this
larger cluster is nearly 2 square millimeters.
= = = = = = = = = = = = = =
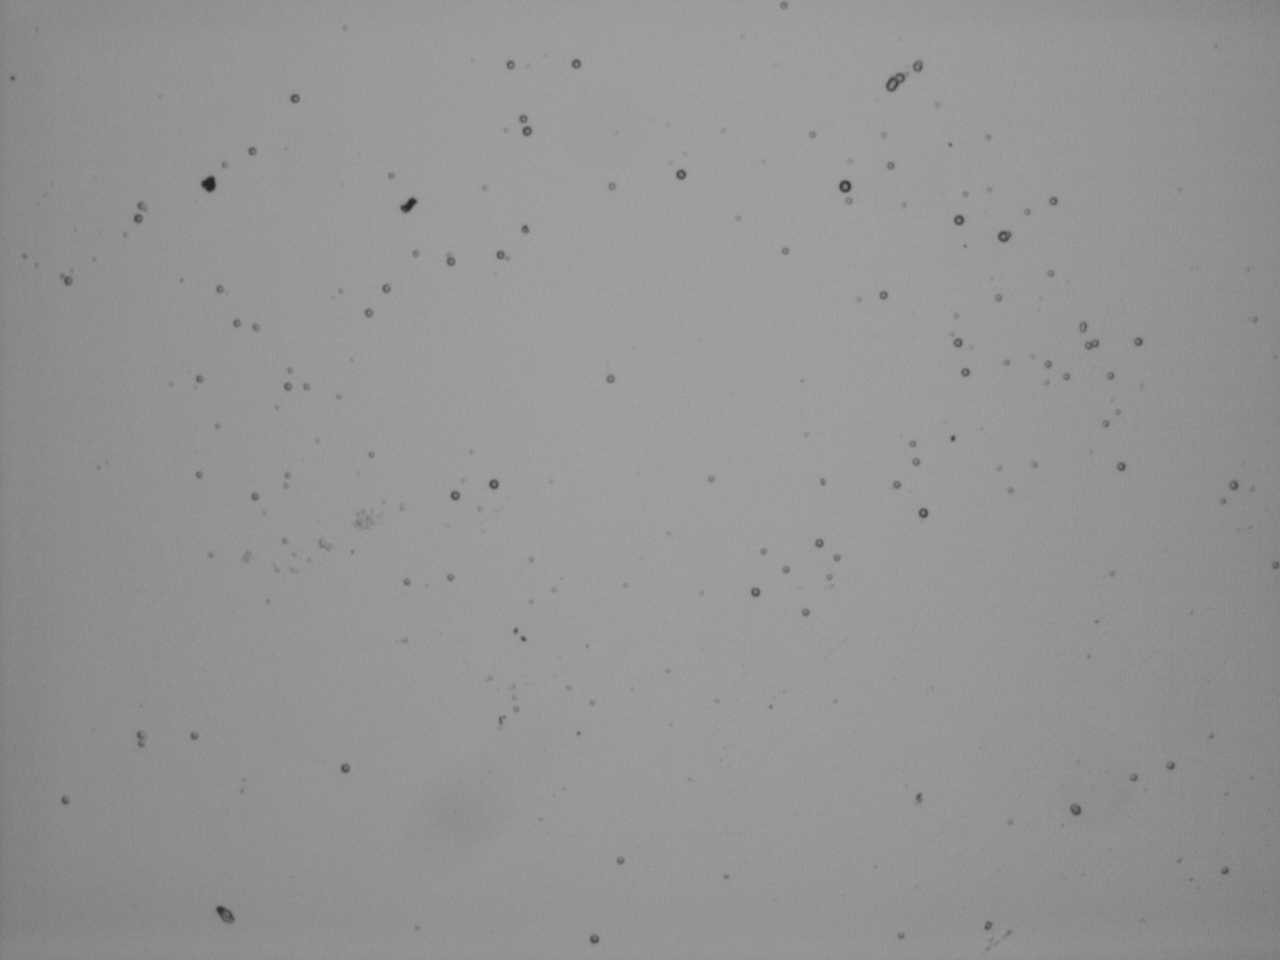
Figure 3
A larger cluster. Magnification 40. The photographed area is about 1.3 by 1.0 mm
= = = = = = = = = = = = = = = = = = = = = = = = = = = =
In that case many tracks have considerably smaller diameters than tracks on pervious figures. Furthermore, tracks on Figures 3 and 4 seem to be more shallow (as
revealed by the effect of focusing).
= = = = = = = = = = = = = =
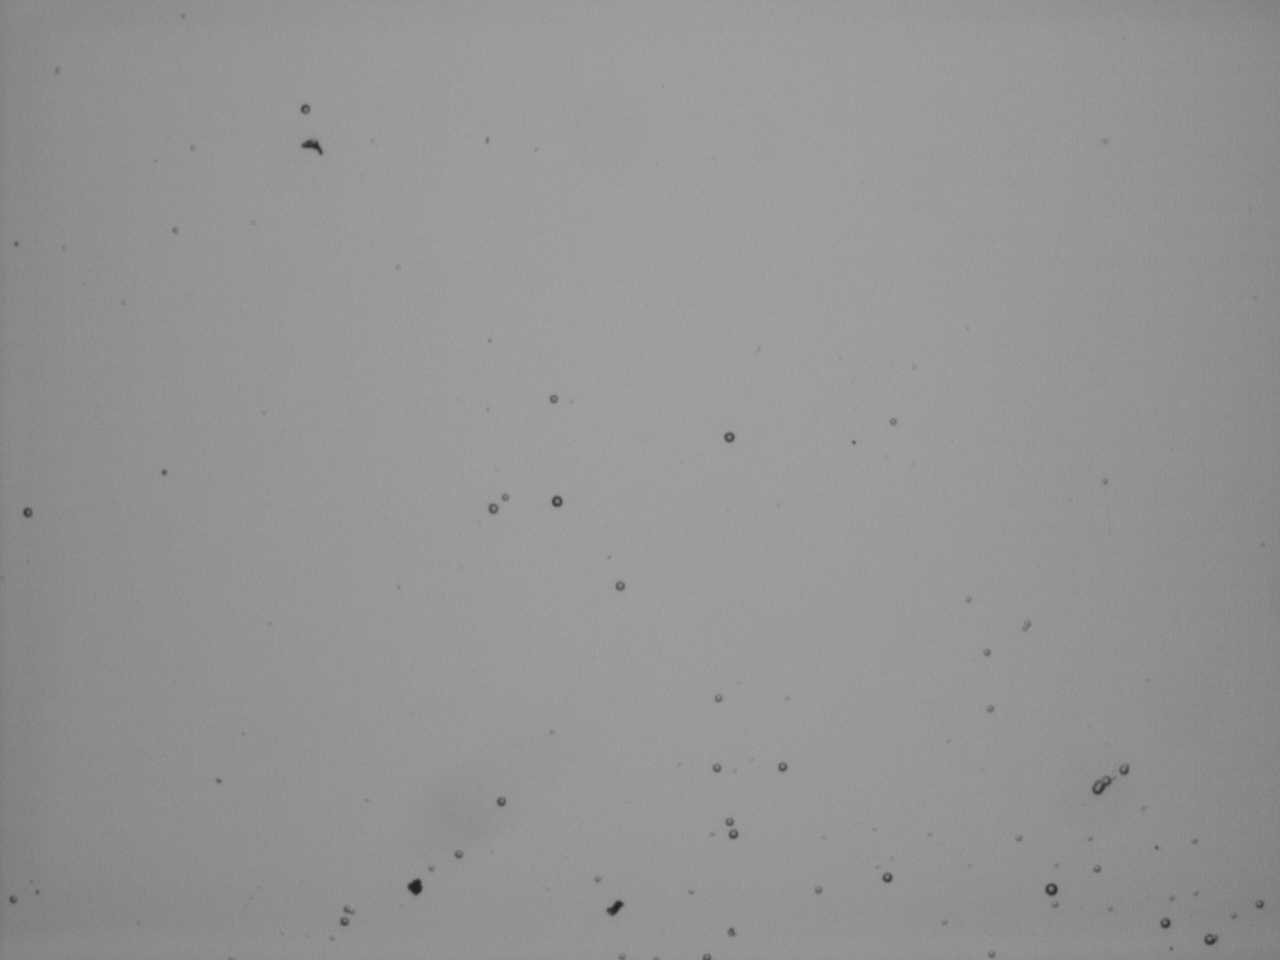
Figure 4
A small cluster of tracks. Magnification 40. The photographed area is about 1.3 mm by 1.0 mm. This figiure shows what is above Figure 3.
= = = = = = = = = = = = = = = = = = = = = = = = = = = =
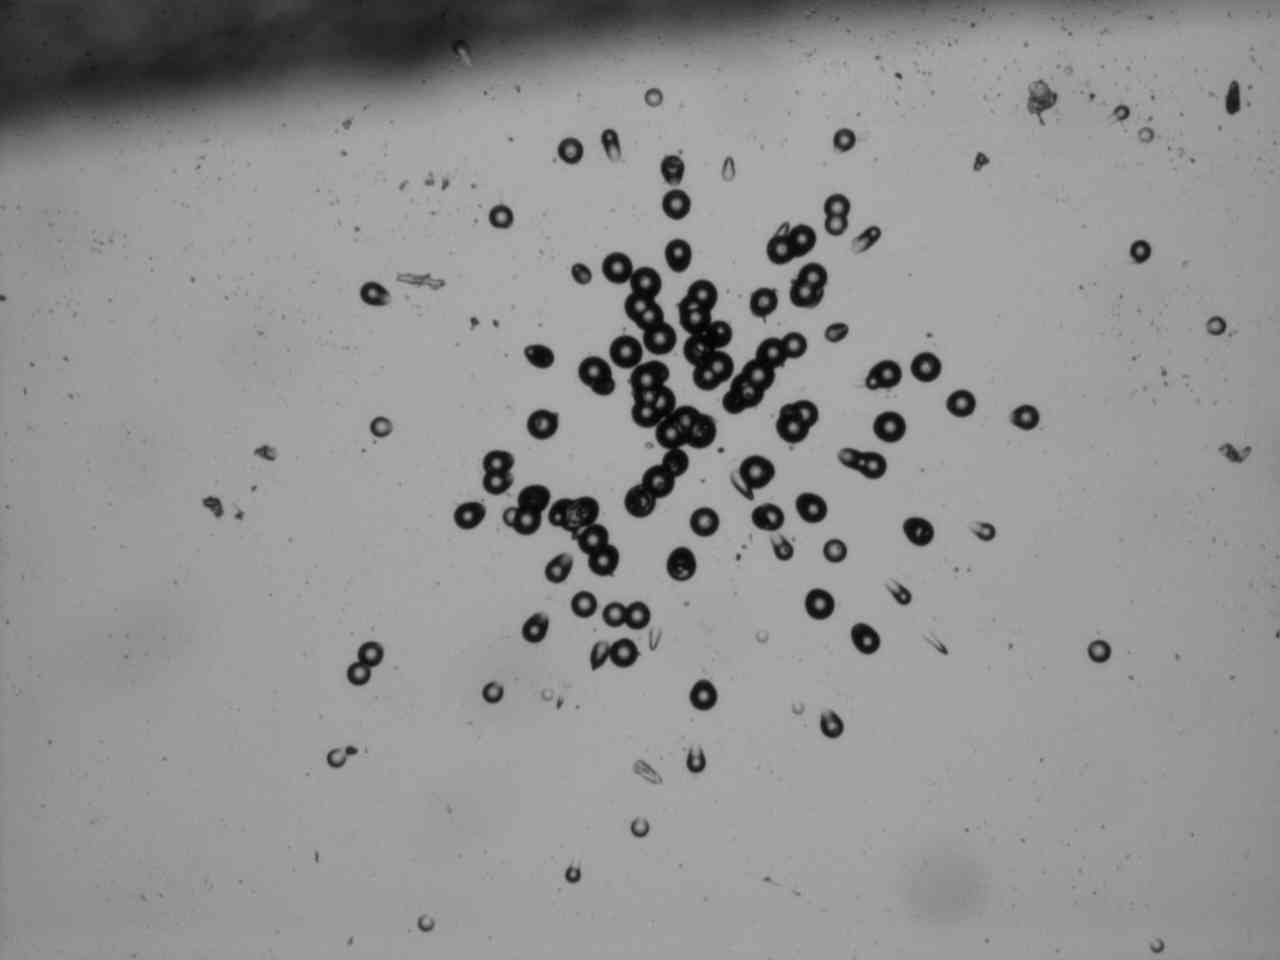
The next figure shows a spectacular cluster of tracks that seem to be due to nuclear particles moving from a point source. Oriani already reported similar clusters
on the private list for CMNS researchers. Someone might think that tracks are due to cosmic rays. What kind of cosmic ray collision can produce such a tiny cluster? How frequent are
such collisions? Perhaps some cosmic rays experts will answer these questions.
= = = = = = = = = = = = = =
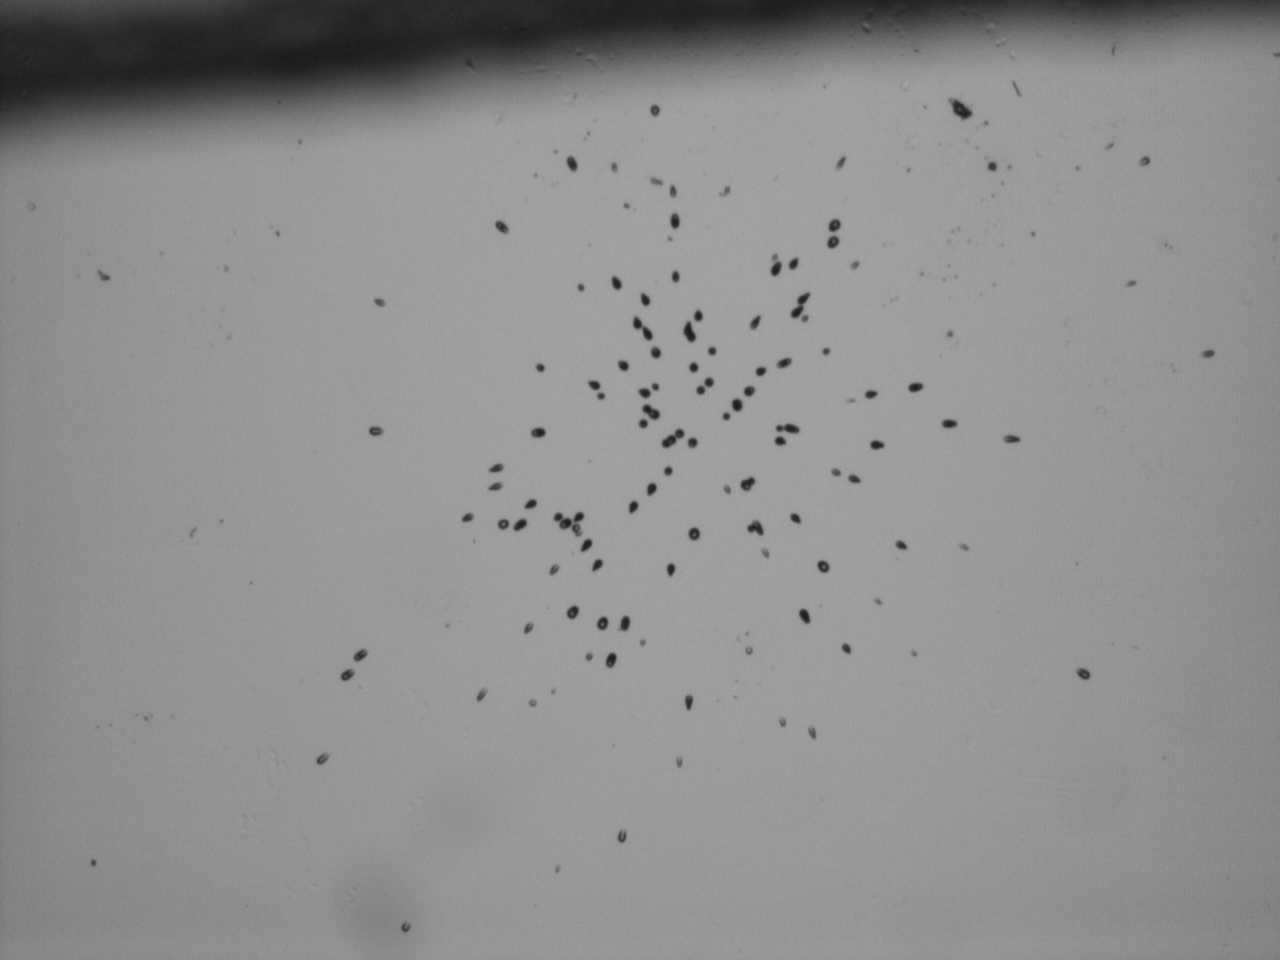
Figure 5
A small cluster of tracks. Magnification 40. The photographed area is about 1.3 mm by 1.0 mm Some of the tracks of this figure are also shown in Figure 6, at much
higher magnification.
= = = = = = = = = = = = = = = = = = = = = = = = = = = =
= = = = = = = = = = = = = =
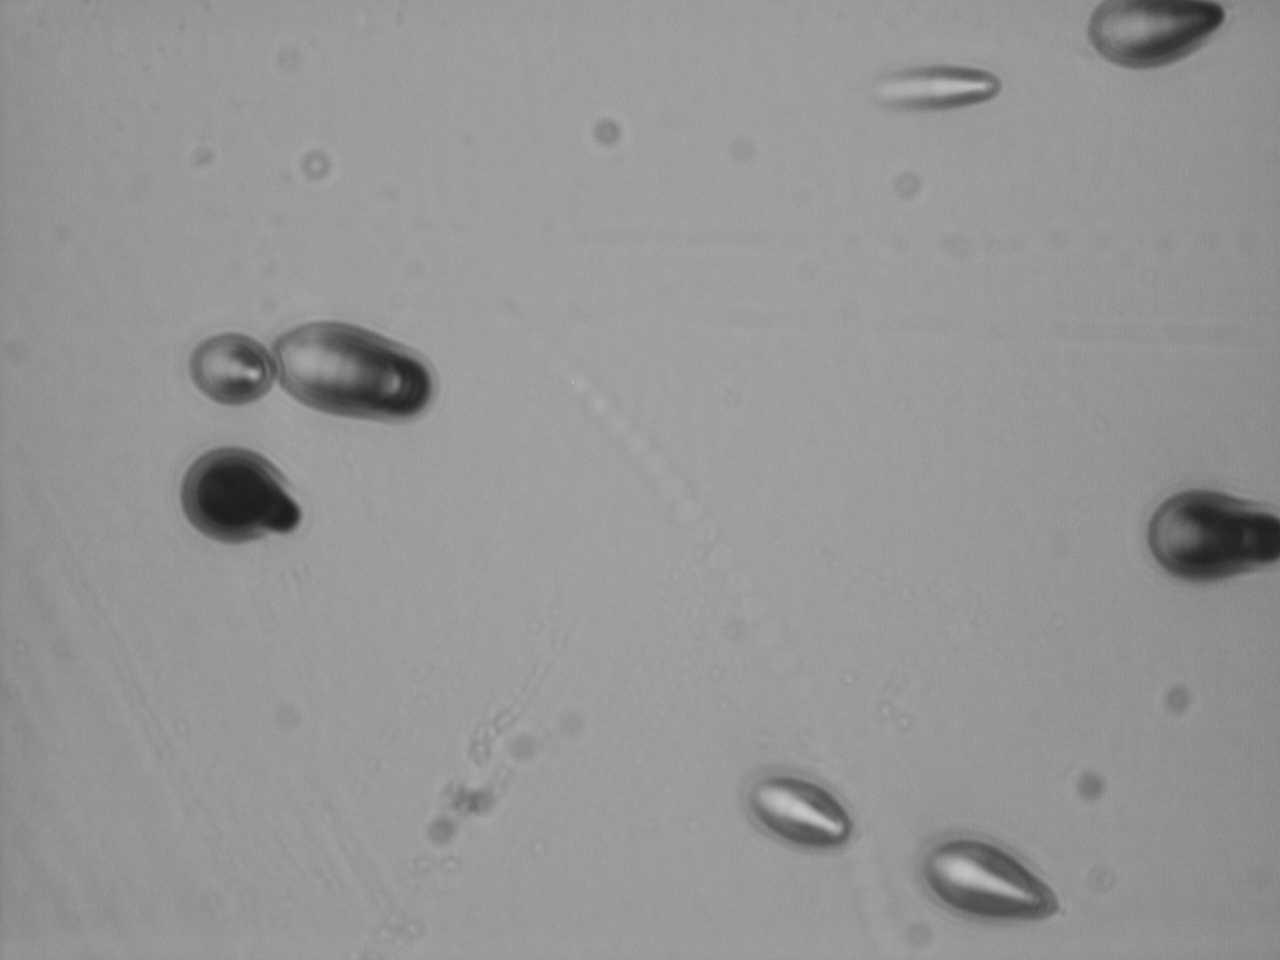
Figure 6
A small cluster of tracks. Magnification 400. The photographed area is only about 0.13 mm by 0.10 mm. Tracks seen here belong to the cluster shown in Figure 5. In fact,
one can identify them in Figure 5 by looking along the "one o'clock direction" from the center on the cluster. More than one half of track in Figure 5 are elliptical.
= = = = = = = = = = = = = = = = = = = = = = = = = = = =
How can there be any doubt that most of tracks on my figures are indeed
due to nuclear projectiles? Oriani told me today that he now has twenty consecutive successes. My first experiment seems to confirm the idea that a starter of some
kind (seeding, kindling, etc.) does play an important role. My attempts to replicate his results failed without a starter and succeeded with the starter. Three cascades
in one experiment ! Let us see what the next two experiments will bring, my experiment and Marissa’s experiment. Marissa is a very young researcher; that is very
important, considering ages of most CMNS researchers.
5) In a private message a nuclear physicist wrote: "Cosmic rays cannot be responsible for small clusters. A number of arguments can be used to support this opinion.
Here is one of them. CR-39 chips are widely used as dosimeters. That application would be impossible if the number of tracks observed in only 100 hours was as large as
on your pictures." I agree; dosimetrists would discovered small cosmic ray clusters long time ago. Note that my control CR-39 chip, of same size, that was etched at
the same time, showed zero clusters. In fact, it had practically no tracks at all, as described in unit #327. Also most of the 1.3 by 1.0 mm areas, away from my three
clusters, are practically without tracks (less than one track per field, on the average).
6) On the CMNS list Scott Little wrote: “Your cluster is wonderful. It closely resembles a photo Richard shared with us a while back. Frankly, it looks to me like
the result of placing a small particle of radioactive material on the CR-39 for a while. There are hundreds of tracks which all appear to originate from a common point.
How could a single high-energy particle (i.e. cosmic ray) produce such a shower?” Primary cosmic rays contain relativistic heavy ions. But such ions are very rare,
I think. Collisions between relativistic heavy ions, such as gold, have been studied intensively at BNL (Brookhaven National Laboratory) for at least ten years. My
understanding is that nuclear projectiles produced in such collisions have much longer ranges than particles responsible for tracks in Figure 6. . . . BNL is only two
hours away (driving) from my home, and I have friends working there. It would not be difficult to consult with them. But first we need more data.
7) Time=15 hours, 9:15, 5/8/07 (Second experiment started at 18:15 on 5/7/07)
All is fine with the ongoing experiment. I=41 mA, cell potential is 5.93 volts. I will keep this current till the end of the experiment.
8) Time=27 hours, 21:15, 5/8/07
I=41 mA V=5.97 V
I forgot to mention something very important; the cluster shown if Figure 5 is located at edge of my CR-39 detector. That edge was actually in air, outside
the cell. Why do we put the cathode in contact with the CR-39 chip? Because that was in the SPAWAR protocol. Richard Oriani modified that protocol by placing a very thin
mylar film between the cathode and the CR-39 chip. The purpose was to protect the chip from a chemical attack of the electrolyte; hence the acronym PACA: Protection
Against Chemical Attack. The film was sufficiently thin to transmit alpha particles.
This morning I read Oriani’s and Fisher’s papers presented at ICCF10. Their clusters were observed above the electrolyte, in the escaping gasses, as illustrated on
page 568 (of the conference proceedings). That was several centimeters away from the cathode. Below is their Figure 2 (from page 571 of the ICCF10 proceedings). The
upper photo is the chip before the electrolysis while the lower photo shows the same chip -- exactly the same location -- after the electrolysis. What a difference!
A surface deffect near the lower left corner proves that the same area is being photographed.
= = = = = = = = = = = = = =
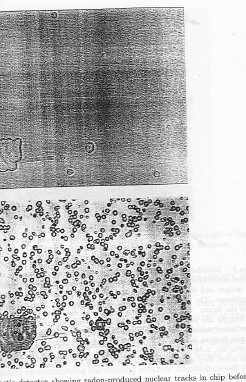
Figure 7
An illustration from the 2003 paper of R.A. Oriani and J.C. Fisher.
= = = = = = = = = = = = = = = = = = = = = = = = = = = =
9) On the basis of Oriani's table (which was posted before his additional successes, and before my one replication) I tend to believe that experiments are reproducible.
Taking this for granted I just decided to run my experiment for much longer than five days. In a reproducible situation, an experiment that is run ten times longer
should produce ten times more cascades, subject to usual statistical fluctuations. I do not have another large CR-39 chip to start another experiment. Is there any
good reason for me to stop after five days?
And here is another reason for very long experiments. A success, according to Fisher and Oriani, is highly unlikely, unless "a starter" is provided. We do not know
what the starter (seed, NAE, etc.) is. But we know that it is in the O-rings and/or in mylar from a successful experiment. We use it as kindling to start another fire.
We also do not know how long the kindling will remain effective. Therefore, for the sake of future experiments, we must keep the fire going on continuously. In other
words, running very long experiment, one after another, is desirable, till a reliable "igniter" is invented.
10) How solid is the evidence that kindling is essential? To answer this question one should perform several consecutive experiments with new O-rings, mylar and the
electrolyte. Would five or more such experiment produce negative results? If so then the essential effect of a starter (or a combination of starters ?) Would be
established. My failures to replicate Oriani’s results without a starter might be due to the fact that the CR-39 chip was too small and not in a right location. After
all, the central part of my large CR-39, the one with three clusters, has no tracks in the central region.
11) The beauty of Oriani's method -- squeezing the entire sandwich (mylar + CR-39) rather than squeezing mylar only -- is its mechanical strength. The electrolyte
is no longer supported by mylar; it is supported by the entire sandwich. I can push down the anode-cathode setup without being afraid to puncture mylar The only
precondition for this is that the cathode wire, the foot, should have no sharp points. In fact, I pushed that setup down several times, to make sure the cathode is
really in contact with the sandwich. Fortunately, no complications are introduced by squeezing the CR-39 between two O-rings.
12) Time = 37 hours, 7:15, 5/9/07
I=41 mA, V=5.73 volts.
13) One scientist on the CMNS suggested a theoretical explanation of what is going on. That interpretation is not at all obvious, or easy to defend. Responding to
this, also on the private list for CMNS researchers, I wrote: What is the best strategy to convince mainstream scientists that CANR are real?
I think that the issue is worth discussing. My advice would be to ask all theoreticians not to inject theoretical interpretations until facts are recognized as real.
Remember what happened in 1989. Instead of focusing on real experimental facts (generation of excess heat) discussion quickly shifted to theoretical considerations,
such as coulomb barrier, expectations based on wrong models, etc. It would be much better if the F&P phenomenon was called UEH (unexplained excess heat) rather
than CF (cold fusion), until the reality of UEH were recognized by all scientists.
If it were up to me I would recommend focusing on our new experimental facts. Let us agree that clusters of tracks are not due to artifacts, such as radioactivity
or cosmic rays. Let us agree that clusters are likely to be due to unexplained nuclear projectiles (UNP). Then let us try to convince others that UNP are real.
Trying to mix experimental facts with theories might backfire again. We want people to look at our experimental data; we want them to perform experiments; we do
not want the debate to shift toward the as-yet-unaccepted ideas.
I know it is a touchy issue. Theoreticians do not want to be told what to do, what to publish and how long to wait. And we all believe that pure empiricism is
not science. Theoretical debates are essential. But, like other powerful tools, theories can have both positive and negative effects. I am afraid that premature
theoretical considerations can produce more harm than good at this delicate stage. What do other people think?
14) Time = 52 hours, 22 :15, 5/9/07
I=41 mA, V=5.47 volts.
15) John Fisher informed the CMNS list that he also replicated Oriani’s experiments. He tried three times and each time he saw clusters. In two of his experiments
small CR-39 pieces (probably 2 by 1 cm) were entirely in air, at the level of O-rings. He is going to send me one of his chip and I will make pictures of his
clusters. Inspired by this, I just placed four small chips (each of 2 by 1 cm) on little wooden pedestals, also at the level of O-rings. Each chip is along a
diagonally of my large CR-39, which has been under the electrolyte for 52 hour (when four additional chips were positioned). Each of these four chips has a scratch
on the facing up surface. The distribution of chips is shown in Figure 8 below.
= = = = = = = = = = = = = =
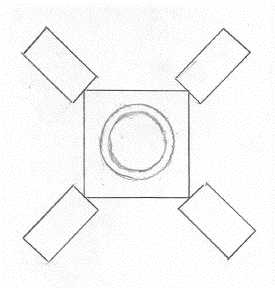
Figure 8
Configuration of five chips in the second experiment. The cirle represent the O-rings, the large square represents the 3 by 3 cm CR-39 chip, and diagonally oriented
rectangles represent four smaller CR-39 chips (each 2 by 0.9 cm). Note that the total CR-39 area is nearly doubled. Small detectors are supported by pieces
of wood. They are in the same plane, approximately, as the large rectangular detector.
= = = = = = = = = = = = = = = = = = = = = = = = = = = =
16) Time = 72 hours (3 days), 18:15, 5/9/07 I=41 mA, V=5.43 volts.
17) Today my large post-electrolysis chip (9 cm^2) was examined again. Here are some additional observations and suggestions:
a) Three clusters were observed in an experiment that lasted 5 days. That corresponds to the detection rate of 3/5=0.6 clusters per day. Let me assume that 0.6 is
typical. How many cascades would be observed, after 5 days, on a chip whose area is only 0.9 cm^2, as in my unsuccessful experiment? The answer is 0.3. This might
be an explanation why my experiments described with small chips were not succesful. To replicate Richard’s clusters I should have used the detector of the same size
he used. My suggestion is that Marissa runs her experiment for much longer that the anticipated 92 hours. How can this hurt? Tracks created during the first 92
hours would not go away.
b) It is desirable to report numbers of clusters, and to show that areas surrounding clusters have no tracks. That is likely to be more meaningfull than mean track
densities, as in Oriani's table above.
c) The cluster shown in Figure 3 and 4 is much larger than clusters shown in Figure 1 and 5. But it does not contain many times more tracks than smaller clusters.
Is this typical? We need more data.
d) It turns out that the large cluster is on the side of the CR-39 chip that was facing down (away from the electrolyte). Larry would say it was on the “back side.”
Two smaller clusters, on the other hand, were on the side facing up (toward the electrolyte). Is this a coincidence? We need more data.
e) Also note that all pits in the large cluster (a) are mostly round, (b) have a broad distribution of diameters and (c) appear to be more shallow than in the two
smaller clusters. Is this a coincidence? We need more data.
f) Richard performed twenty experiments. I would very much like to know if his observations about clusters are similar to my observations.
g) From the public relation point of view, dispIaying pictures of clusters is highly desirable. The more the better, at this stage of the battle.
d) If the mean number of cascades is 3, and if the distribution of results is Poissonian, as in the case of Geiger counts, then the probabilities, P, for the number
of n clusters (in 5 days on a 9 cm^2 chip) are as follows:
n = 0,    1,    2,    3,    4,    5,    6     etc.
P = 0.05, 0.15, 0.22, 0.22, 0.22, 0.10, 0.04, etc. (the tail where P-->0)
In other words, good replicability is not expected in experiments lasting only 5 days, even for 9 cm^2 chips. About 5% of results are expected to be failures. We
need either a large number of short experiments, like those performed by Oriani, or a small number of much longer experiments. The second seems to be less demanding.
18) Time = 92 hours (four days) 18:15 5/11/07
I = 41 mA, V=5.26 V. About 40% of water was lost; the level is about 1 cm above the anode. I will replace the lost water tomorrow.
19) Time = 107 hours 9:15 5/12/07
I = 41 mA, V=5.15 V. About 50% of water was lost; the level is about 0.5 cm above the anode. It is time to replace lost water. I did this and the potential difference
on the cell became 6.19 V. A correlation between the concentration of the electrolyte and the cell resistance is obvious. But the potential difference did not decrease
by the factor of 2 when the concentration is doubled. It is clear that the measured potential difference is not only I*R.
20) Time = 144 hours 18:15 5/12/07 (end of day 6):
I = 41 mA, V=5.88 V.
21) What follows are five microphotographs from the CR-39 that John Fisher sent me. Each picture covers an area of 1.3 mm by 1.0 mm (magnification 40). The photos
would be much more informative if they could be compared to pits due to alpha particles of known energy under identical etching conditions. Unfortunately, a source
of alpha particles was not available to John.
- - - - - - - - - - - - - - -
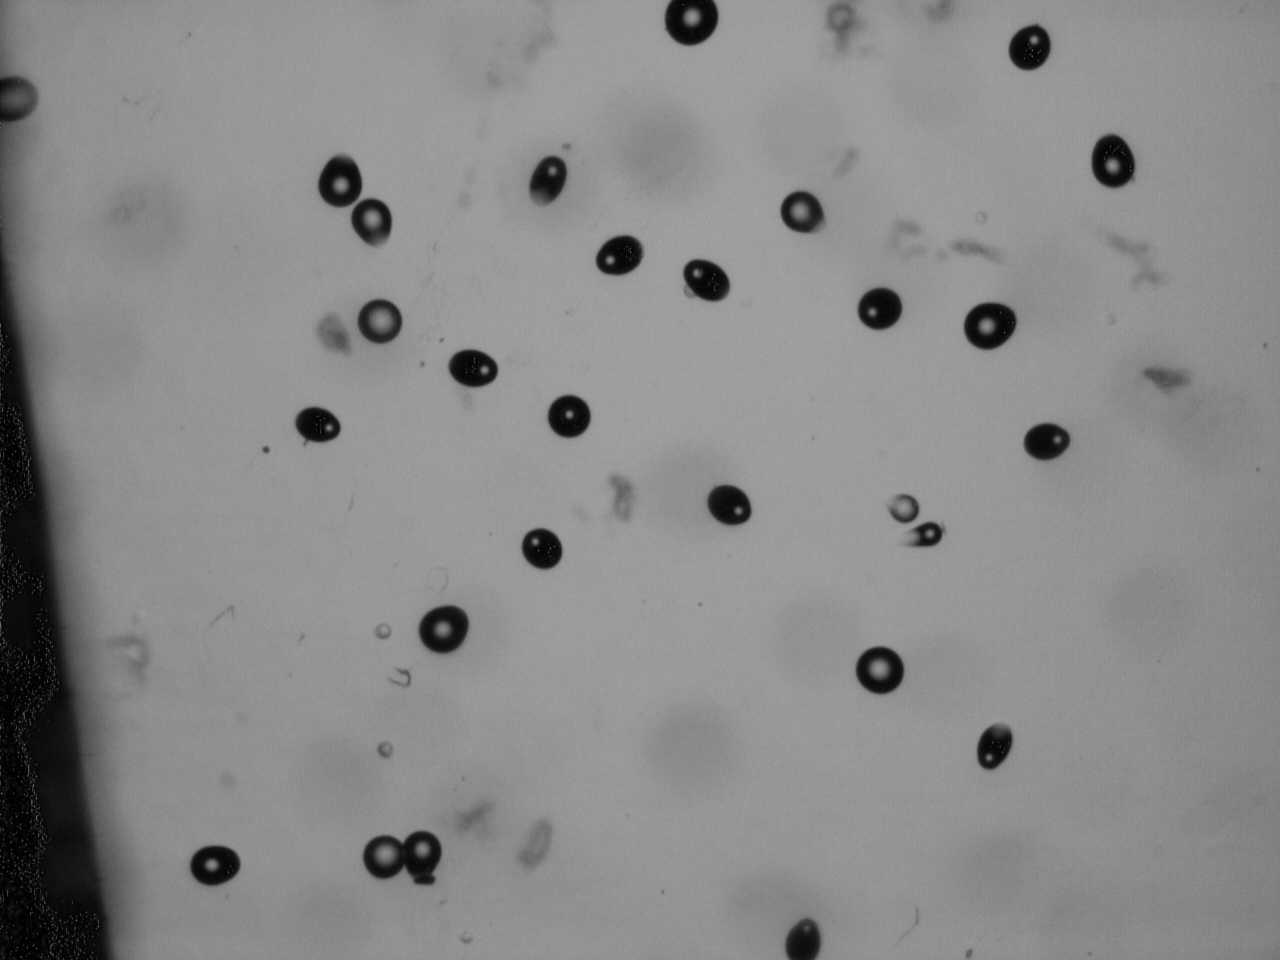
Figure 9
A cluster of very large pits. Very large pits were observed on the back side of the chip only (back side means facing away from the electrolyte).
- - - - - - - - - - - - - - - - - - - - - - - - - - - - - - - - - - - - - - - - - - - - -
Please note that most of the 1.3 mm by 1.0 mm fields contain no pits at all. On the average a background pit can be found in one out of five fields.
- - - - - - - - - - - - - - -
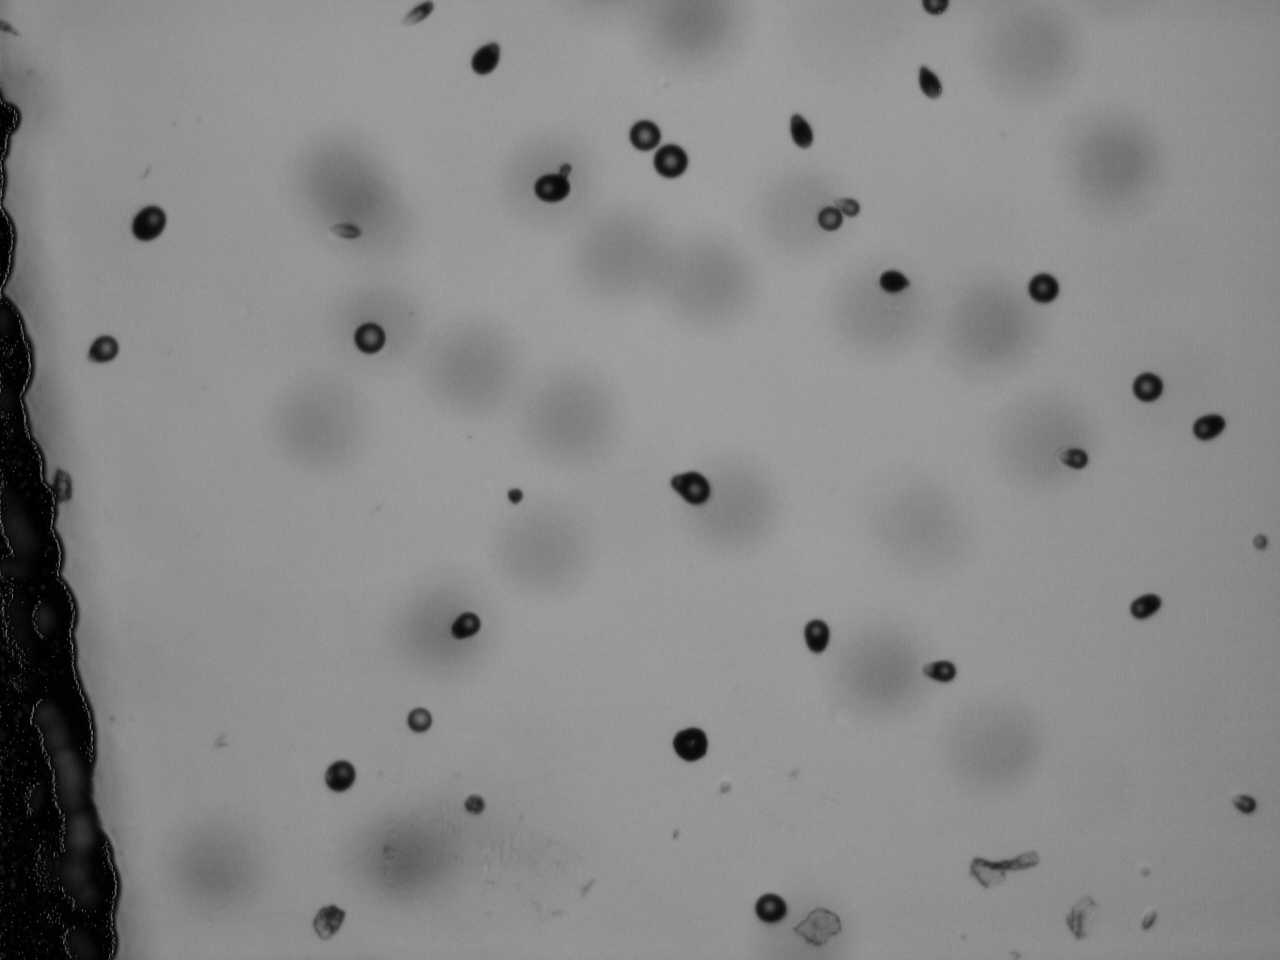
Figure 10
A cluster of medium-size pits on the top side of the chip (front side was facing the electrolyte). All pits, except for the background, are located near the margin
of the chip. More than 99% of pits turn out to be located on less than 5 % of the total area.
- - - - - - - - - - - - - - - - - - - - - - - - - - - - - - - - - - - - - - - - - - - - -
Large dark areas are due to pits on the oppsite side. Being out of focus these back side pits appear to be larger than in the previous figure.
- - - - - - - - - - - - - - -
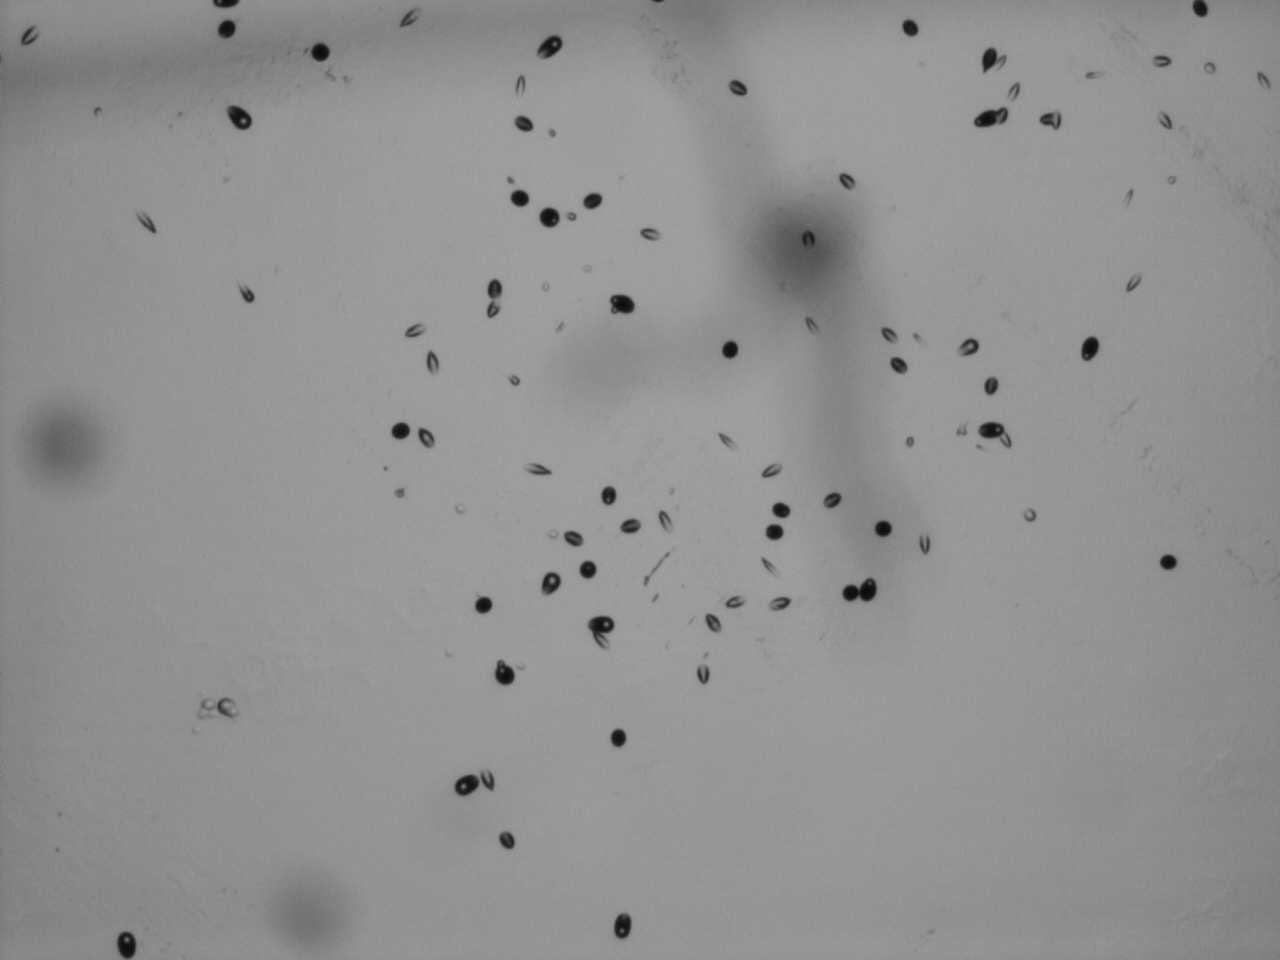
Figure 11
A cluster of small-size pits on the top side of the chip (top side was facing the electrolyte).
- - - - - - - - - - - - - - - - - - - - - - - - - - - - - - - - - - - - - - - - - - - - -
Large dark areas are due to pits on the oppsite side. Being out of focus these back side pits appear to be larger than in the previous figure.
- - - - - - - - - - - - - - -
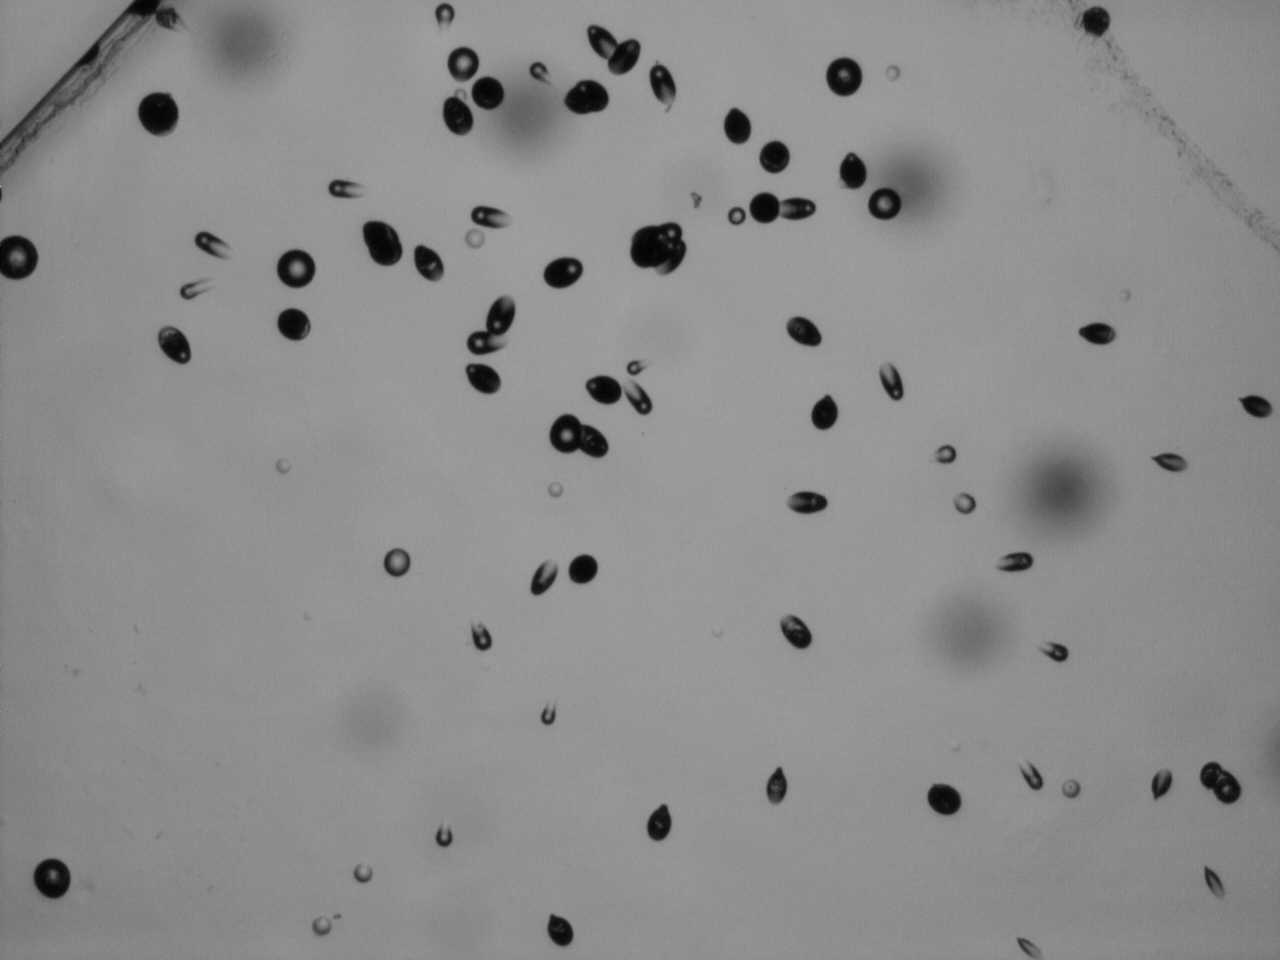
Figure 12
Another cluster of medium-size pits on the top side of the chip.
* * * * * * * * * * * * * * * * * * * * * * * * * * * * * *
22) Time = 195 hours 21:15 5/15/07 (8 days +3 hrs):
I = 41 mA, V=5.55 V.
23) Time = 226 hours 4:15 5/17/07 (end of day 9 + 10 hrs);
I = 41 mA, V=5.40 V. Time to add water. After adding water potential became 6.35. Yes, the level is slightly above where I started.
24) A suggestion was made, on a private list for CMNS researchers, that excessive pits might be created by mylar. This prompted me to set up another control
experiment. It started at 4:00 on 5/17/07.
a) A microscopic slide (glass) is resting on the box. About 6 mm of glass is actually in air, outside the box.
b) Protective films were removed from my CR-39 chip (~2 by 1 cm) and the chip was discharged (by touching it with salty-water-wet fingers.)
c) The chip is placed on the glass slide. About 6 mm of the chip is actually in air, outside the slide.
d) All is covered by the mylar film. About 6 mm of the film is actually in air, outside the CR-39 chip.
e) The small beaker (about 40 cc) is turned upside down and placed on mylar. That is my fake cell.
f) One rim of the cell is close to the edge of the box, actually, it is about 3 mm outside the box.
g) A scratch was made on the lower side of my CR-39 (to recognize it later).
Note that one end of the mylar film is totally in air, more of less as in my main experiments. The "null hypothesis" is that mylar becomes charged, creating an
electrostatic field near the cell. That field attracts radioactive ions (always present in air, due to cosmic rays, radon, etc.) into the region in which my
CR-39 is in contact with air (at the lower side). Will this create excessive pits ? I will know in two or three weeks.
25) Time = 240 hours 18:15 5/17/07 (end of day 10)
I=41 mA, V=6.09 V
26) Time = 265 hours 19:15 5/18/07 (day 11 days + 1 hour)
I=41 mA, V=6.05 V Note: The current I=41 is the nominal value, as measured with a digital ammeter then the current stabilizer was built. I know that the actual
current can fluctuate slightly due to fluctuations of temperature. In other words, the cell potential depends not only on how much water was lost but also
on the temperature. In this experiment an old analog millimeter (full scale 500 mA) and vary accurate measurements are not possible.
The instrument is used to indicate that the current is flowing. I plan to use higher currents (80 mA and 150 mA) before ending the experiment in June. Why? Because
these currents were used in the experiment in which clusters were first observed. I do not know at what current the clusters were actually recorded.
27) Time = 293 hours 23:15 5/19/07 (12 days + 5hours)
I=41 mA, V=5.94 V
28) Time = 306 hours 12:15 5/20/07 (12 days + 18 hours)
I=41 mA, V=5.88 V
29) Time = 336 hours 18:15 5/21/07 (14 days)
I=41 mA, V=5.63 V
30) Time = 352 hours 10:15 5/22/07 (14 days + 16 hours)
I=41 mA, V=5.54 V
The level of the electrolyte is again about 1 cm above the anode. I will water now. After adding water V=6.57 V
31) Here is a message I posted on the CMNS list last night.
Scott Little wrote: “When examining the etched CR-39 under the microscope, each track you find always raises the question, "Is this
a nuclear track or not"? The ones that are elliptical and have a distinctly conical shape have a high probability of being of nuclear origin. The ones that appear
to be perfectly round but still have a conical shape are likely to be of nuclear origin. The ones that are perfectly round and relatively flat-bottomed are
disturbingly ambiguous.”
**) One should expect a large fraction of tracks to be elliptical when the source of alpha particles is very close to a CR-39 chip. But nearly all alpha particle
tracks are circular when the distance between the source and the detector is larger than 5 or 10 mm.
**) Looking at my three clusters, I see that the smallest one (Fig 5 and 6) has many elliptical pits. This could be interpreted as an indication that a nuclear
process we want to replicate took place somewhere very close to the CR-39 chip. But pits in a larger clusters (Fig 1) are mostly round. This might be an indication
that the process is taking place several millimeters away from the CR-39. The same can be said about the even larger cluster (Fig 3 and 4). In this case the distance
might be even larger because the cluster is much larger, and because tracks diameters are widely dispersed. (Small diameters would be expected for particles which
lose most of their kinetic energy before being intercepted by CR-39.)
**) In my opinion, it is too early for this kind of speculations, and for experiments suggested yesterday by X. In my opinion we must first agree that "seeded
experiments" are reproducible on demand. As far as I know, each team that received seeds (recently-used Oriani's O-rings and mylar) observed clusters of pits.
These pits are similar to tracks of charged nuclear particles.
**) What will happen when seeds are no longer available? In other words, what will happen when Richard Oriani stops performing experiments, one after another (to keep
the NAE fire going)? I do not know how to answer this question. For the time being as many researchers as possible should ask Richard for seeds (in order to replicate
his results). The issue of possible artifacts, systematic investigation of parameters, and theoretical explanations, can wait till we agree on a high level of
reproducibility. That would be a fantastic accomplishment (of turning protoscience into science?). Do not wait too long, please.
32) Tomorrow is day 16 of my second seeded experiment, as far as the current 41 mA is concerned. That will be four times longer than the duration of my first seeded
experiment. Will I find more clusters than before? I hope so. But that remains to be seen. It is reasonable to expect 3*4=12 clusters, plus or minus 7. Why 7? Suppose
I used a Geiger that registered 3 random particles from a radium source in 4 seconds. Then, the expected result, after 16 seconds, would be 12. For a mean value of 12
the distribution of possible outcomes is essentially bell-shaped and its standard deviation is close to 3.5. To be 95% confident that my expectation is correct, I
would bet on the result that can differ from the mean value by two standard deviations. I expect to see at least 12-7=5 clusters because I assume that things are
reproducible. (But my first experiment also contained 1 day of electrolysis with I=80 mA and 2 hours of electrolysis with I=160 mA. That is why I will run my second
experiment for 4 additional days at 80 mA and for 8 additional hours at 160 mA. I have no idea at what currents were my clusters recorded.)
33) Time = 376 hours 10:15 5/23/07 (15 days + 16 hours)
I=41 mA, V=6.21 V
34) The statistical reasoning in 32 has a mistake. The 95% certainty would be valid if 12 clusters (or 12 Geiger counts) were really discovered in my first experiment.
But the number 12 was an extrapolation. How to evaluate the level of confidence based on an extrapolation? I will ask a statistician. Meanwhile let me follow the
intuitive approach. Three counts were recorded in a random sample drawn from a large Poisoning population. Thus the expected mean is 3 while the expected standard
deviation is 1.73 (the square root of 3). Multiplying this by 4 one gets the mean of 12 and the standard deviation 6.97. The new standard deviationis nearly twice as
large as the value I used above. Therefore the level of confidence, that the result will be between 5 and 19 is only 68% and not 95%. But even this is questionable;
a Poisoning distribution with the mean of 3 is not bell shaped. Well, it is not difficult plot that distribution and to calculate probabilities of various intervals.
But why should I waste time on this? Note that I totally ignored the fact that 21 consecutive experiments of Oriani, plus three consecutive experiments of Fisher,
plus one to-be-confirmed (probably today or tomorrow) experiment of X, were successful.
35) Time = 386 hours 20:15 5/23/07 (16 days + 2 hours)
I=41 mA, V=6.07 V
Removing the current regulator and increasing the cell potential to 9.00 V. The current is 80 mA. I will use this current for 4 days (4 times longer that in the
first experiment).
36) Time=386.25 hrs 20:30 5/23/07
I=82 mA V=9.02 V. I lowered the current back to 80 mA by lowering the potential difference to 8.73 V. Something is probably happened on the surface and lowered the
overall cell resistance. About 15 minutes later the potential became 8.70 V; the current agin increased but very little. I should not pay attention to small voltage
fluctuations. Next voltmeter reading will be tomorrow.
37) Last night the TGP beta team 2 (Marissa Little) reported that they also observed a cluster of about 70 tracks in the first seeded experiment, as illustrated in
Figure I will say more about this in Figure 13 below.
- - - - - - - - - - - - - - - M
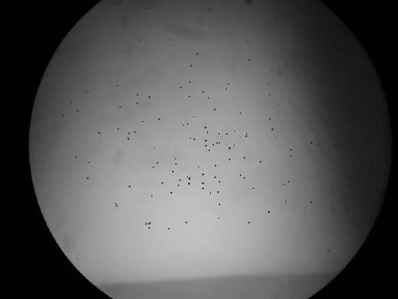
Figure 13
A closter reported by Marissa Little. Note that the cluster is surrounded by the area that has a negligible track density. The magnification was 40; the diameter of the
displayed field is 2.5 mm.
- - - - - - - - - - - - - - - - - - - - - - - - - - - - - - - - - - - - - - - - - - - - -
The etching temperature of the beta 2 team was 65 C. That is why sizes of pits are smaller than those shown in my Figure 1. Here is a brief message that Marissa just
posted on the private list for CMNS researchers. “I’ve organized all of the experimental data for our PACA replication into an online logbook
that I will keep up to date from now on. You can read about the first two experiments we completed and the two that are running now.
http://www.earthtech.org/PACA/logbook.html
Just a brief summary, our first experiment showed nothing anomalous. While waiting for additional o-rings from Richard, we ran a second experiment with what we thought
were “dead” o-rings. The second experiment produced a cluster and a higher than background track count. Exp #3 and #4 are currently running (with fresh o-rings from
Richard). Let me know if you have any questions of comments.”
37) Time=387 hrs 21:15 5/23/07
I=81 mA V=8.76 V. I lowered the current back to 80 mA by lowering the potential difference to 8.24 V. Something is probably still happened on the surface and lowers
the overall cell resistance.
38) Time=389 hrs 23:15 5/23/07
The current is about the same. V=8.40 V.
39) Time=396 hrs 6:15 5/24/07
The current is about the same. V=8.31 V.
40) Time=402 hrs 12:15 5/24/07
I =86 mA, V=8.22 V. To bring I back to 80 mA the V had to be lowered to 7.85 V. So I will continue with I=80 mA and V=7.85 V
41) Time=410 hrs 20:15 5/24/07
I=83 mA, V=7.84 V. To bring I back to 80 mA the V had to be lowered to 7.70 V. So I will continue with I=80 mA and V=7.70 V. How much of this is due to the
progressive loss of water and how much to the instability of my simple d.c. power supply?
42) There was an interesting discussion, on a private list for CMNS researchers, about publishing our excitning results in a mainstream journal. Responding to someone,
I wrote: “ Yes, establishing repeatability should be the highest priority. I would not worry about possible artifacts, or about testing of the seeds hypothesis. Let
us first reach the stage at which each of us, not only Oriani, can say, with confidence, 'do what I do and you will probably observe clusters, and excess tracks.' This
can be accomplished in June, if we are lucky with the three ongoing experiments, my #2 and your #2 + #3. Also experiments of three other people on whose help Richard
is counting. A paper Oriani suggested, with appendices from four or five teams, would be worth publishing, even if explorations of possible artifacts are still in
progress. A protocol for a reproducible-on demand demo should be published as soon as each of us has additional replications. This will probably create a very favorable
situation for new projects. But the seeding precondition should be part of the protocol, as I wrote yesterday.”
Several hours later Marissa Little wrote: “I disagree. I think it is vital to investigate the possibility of artifacts before we publish. If the paper is published
without evidence supporting the hypothesis that these tracks are indeed due to nuclear reactions occurring in the cell, it will be quickly dismissed by the scientific
community at large. What if the effect turns out to be due to something mundane and not to nuclear particles? It would be very bad to have a published claim of a
repeatable LENR experiment only for it to turn out to be an artifact. In order for LENR research to be accepted by mainstream science, researchers must be even more
diligent with their investigations than those working in other fields. I don’t think LENR scientists should publish early with preliminary results. I would not be
comfortable publishing our results until a thorough investigation has been completed to rule out all artifacts and mundane causes for the effect. Only then will we
be equipped to present a complete story that will speak for itself. At this juncture, I would have to 'argue' that the tracks were caused by LENR rather than the
data “stating” that they were. I am not comfortable arguing any position in science. Let the facts speak for themselves.”
43) Time=324 hrs 10:15 5/25/07
I =85 mA, V=7.61 V. To bring I back to 80 mA the V had to be lowered to 7.33 V. So I will continue with I=80 mA and V=7.33 V. I will have to add water this evening.
44) Time=435 hrs 21:15 5/25/07
I =89 mA, V=7.37 V. To bring I back to 80 mA the V had to be lowered to 7.08 V.
Add water. Current goes down to 54 mA at V=7.15 V. To bring I to 80 mA I had to increase the potential to 8.94 V. This 80 mA should be kept for 4 days. I started it
at 20:15, on 5/23/07. So I have run it for 2 days and one hour. The end will be on Sunday evening (5/27/05). Then 8 hours at 160 mA and the end of this second experiment.
Oriani is sending a chip to start another experiment. He thinks that another experiment will have more value that runing the current experiment for much longer.
45) Time=436 hrs 22:15 5/25/07
I =88 mA, V=8.89 V. To bring I back to 80 mA the V had to be lowered to 8.43 V.
46) Time=4446 hrs 8:15 5/26/07
I =80 mA, V=8.28 V.
47) Time=455 hrs 17:15 5/26/07
I =88 mA, V=8.27 V. To bring I back to 80 mA the V had to be lowered to 8.01 V.
48) Time=472 hrs 10:15 5/27/07
I =91mA, V=7.97 V. To bring I back to 80 mA the V had to be lowered to 7.51 V.
Go from 80 mA to 160 mA
V=11.48 V before adding water and 13.30 V after adding water.
50) Time = 481.50 hrs; 20:45 5/27/07
I=200 mA, V=13.2 V. Lower V to 11.30 V to go back to 160 mA
51) Time = 482 hrs; 22:15 5/27/07
I=169 mA, V=11.49 V. Lower V to 11.03 V to go back to 160 mA
Use this current for 8 hrs (to match the 16 days at 40 mA) and then for 0.5 hrs (to match one extra day of 40 mA). Then go to 80 mA for 6 hours (also to match
the extra day at 40 mA) and finally to 40 mA for 24 hours. End the experiment on Tuesday, 5/29/07, provided the CR-39 for the next experiment arrives.
If not then keep running for another short 40, 80, 160 cycle.
52) Time = 506 hours; 22:15 5/28/07
I=41 mA, V=5.86 V. Experiment proceeds as planned; I am in the middle of the last 24 hours, unless the CR-39 chip for the next experiment does not arrive tomorrow.
The mean background on that chip, as specified by Oriani, is 16.6 tr/cm^2; st.dev. 9.7. hat is about the same as he wrote about the previous chip. But that chip
actually had about ten times lower background.
53) Time = 514 hours (21.5 days since the beginning); 6:15 5/29/07
I=40 mA, V=5.89 V.
54) Time = 518 hours (the end of electrolysis is not far away) 10:15 5/29/07
I=40 mA, V=5.76 V
55) Time = 523 hours (ending the electrolysis at 15:15 5/29/07)
56) Summary
Experiment #1 lasted 5.08 days (~79% at 41 mA, ~20% at 80mA and 1.7% at 160 mA)
Experiment #2 lasted 21.8 days (523 hours, with the same percentages as above). I expect to see about 12 clusters, plus or minus several, depending on the
fluctuating level of optimism.
57) Experiment #3 started at 16:50 on 5/29/07, less than an hour after the end of the experiment #2. The electrolyte was the same as used in experiment #1
(in which three clusters were found) and reused in experiment #2, which just ended. But new mylar is used in the experiment #3.
58) About exeriment #2:
Results from the experiment #2 will be posted below, as I did after the experiment #1. One thing should be mentioned. In taking apart the cell used in the experiment #2
I noticed some moisture on the CR-39 surface below the mylar. That surface was dry at the end of the experiment #1. I suspect some tiny holes in mylar (used by Oriani and
then by me in two experiments) were responsible. It was not a leak; only a very thin layer of moisture. And only near the center. I do not think that the layer of moisture
could create interpretational problems, especially if clusters are found outside the O-ring area. No visual sign of any kind could be seen on the surface after the moisture
was wiped out. I will examine the surface under the microscope, before etching, as well. Tomorrow I will probably etch the chips and have the first look at them under the
microscope.
What has been done today (5/30/07)? The chips from the experiment #2 were etched for 6 hrs (NaOH 6.25 N at 73 C). At the same time the already-etched chip from
the experiment #1 (with three clusters) was etched again for additional 5 hours. I will start examining the chips from the experiment #2 tomorrow. Today I examined the
chip from the experiment #1. Perhaps longer etching will tell us something important. What did 11 hours of etching did to tracks of alpha particles? Tracks became much
larger, as shown in Figure 14 below.
- - - - - - - - - - - - - - -
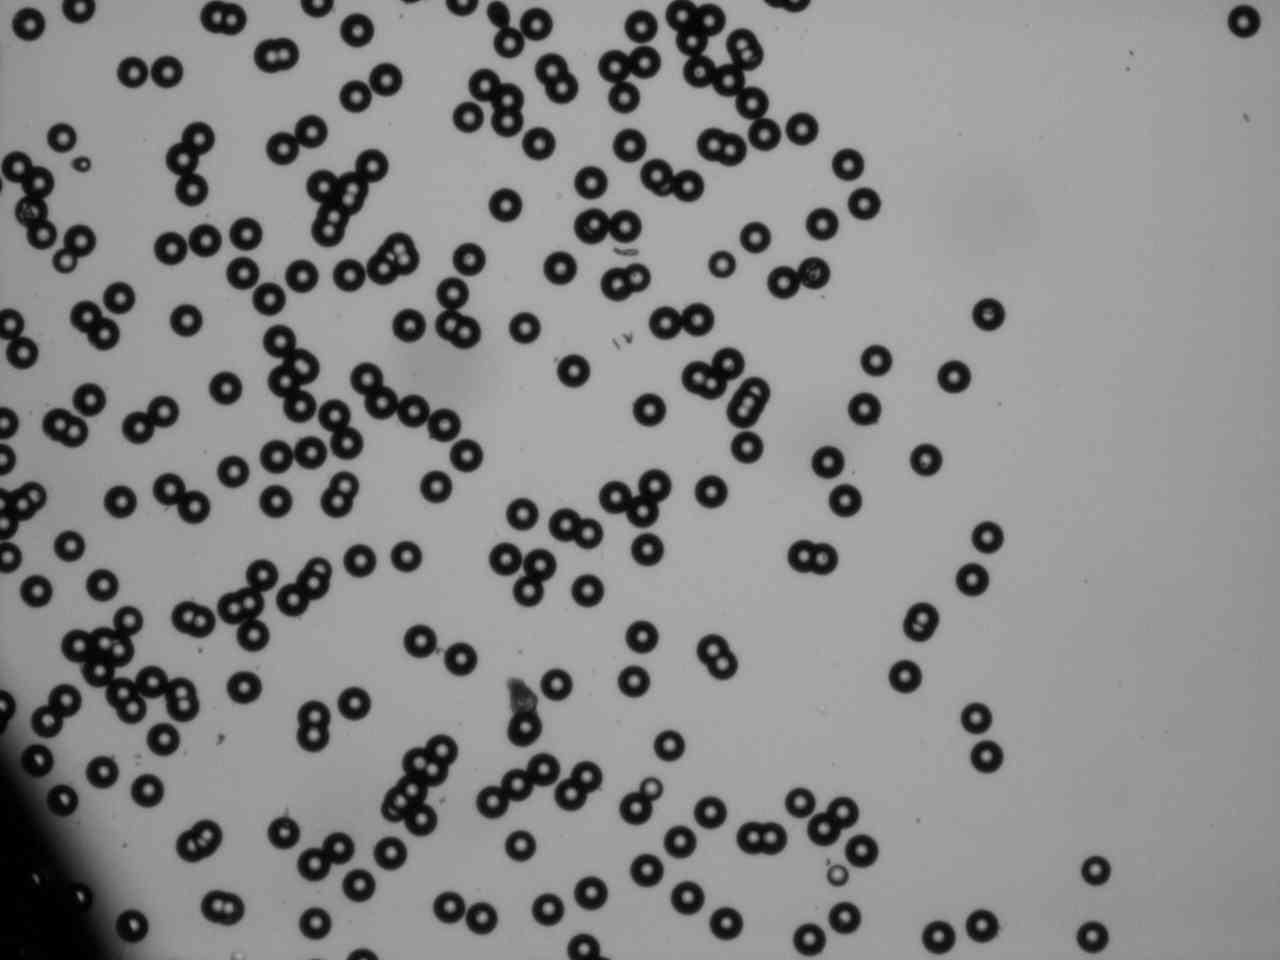
Figure 14
Tracks of alpha particles from Am-241 after 11 hours of etching. Compare them with tracks after 6 hours of etchin, in Figure 2. Magnification 40. The field shown is about
1.0 by 1.3 mm.
- - - - - - - - - - - - - - - - - - - - - - - - - - - - - - - - - - - - - - - - - - - - -
The Figure 15 below shows a cluster which I though was the same as in Figure 1, except the tracks are larger. But now I am not sure. Perhaps it is a cluster I missed before.
Or it can be the same cluster as in Figure 1 except that some tracks were washed away. Unfortunately, it is not easy to find exactly the same spot. Missing a cluster on
this chip is easy because it became twisted.
- - - - - - - - - - - - - - -
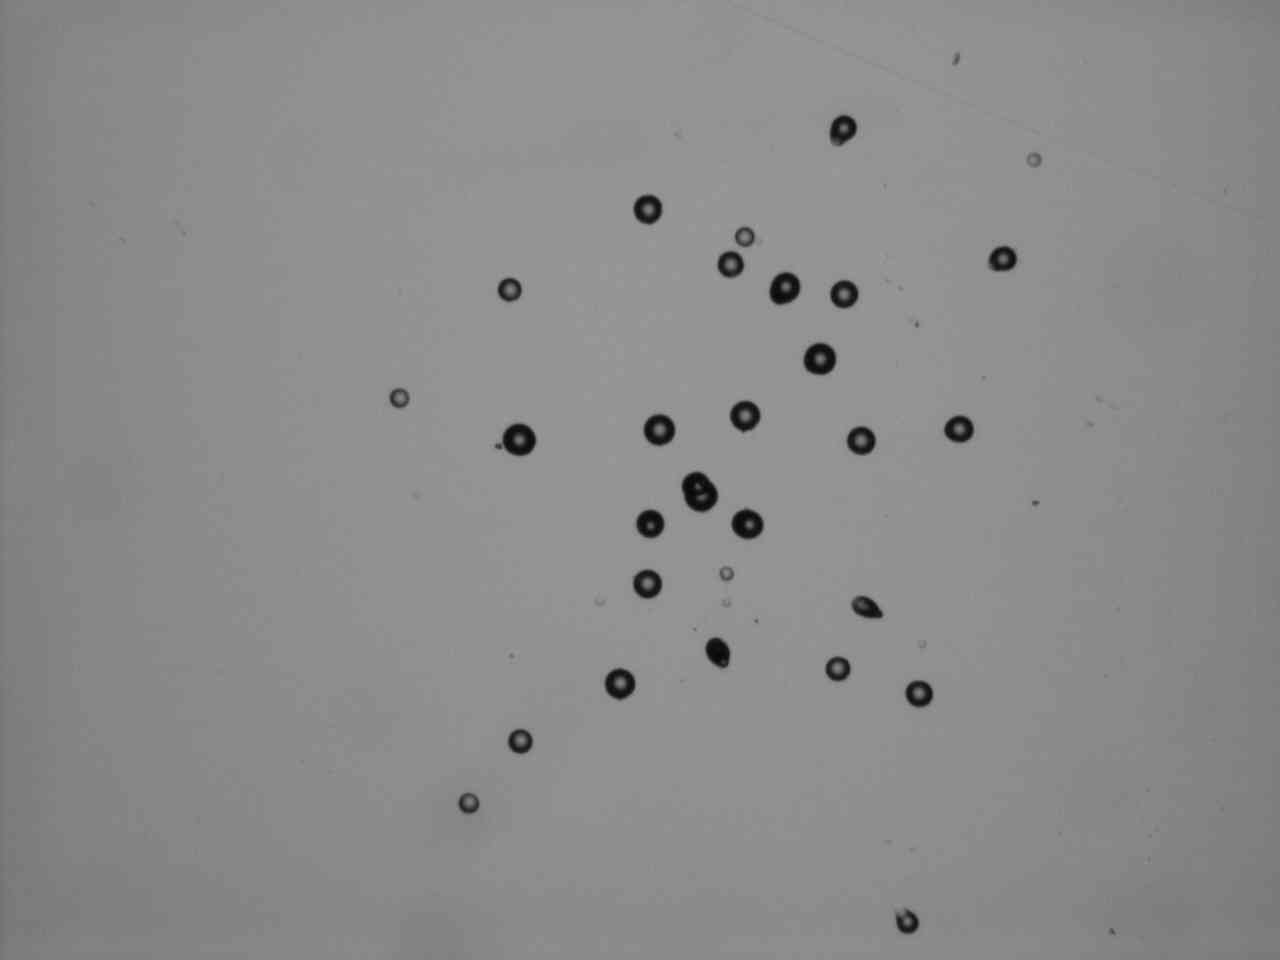
Figure 15
Is this a cluster I missed before or is it a cluster that lost some tracks due to additional etching? Magnification 40. The field shown is about 1.0 by 1.3 mm.
- - - - - - - - - - - - - - - - - - - - - - - - - - - - - - - - - - - - - - - - - - - - -
The figure 16 below shows the same cluster as in Figure 5, except that tacks are larger. One thing becomes clear; many tracks that were elliptical before became round.
That is good to keep in mind. Large tracks are easier to count but loosing elipticity might not be desirable. Another undesirable thing is that tracks are overlapped
more often.
- - - - - - - - - - - - - - -
(BR>
Figure 16
A cluster that was shown in Figure 5, after additional 5 hrs of etching. Magnification 40. The field shown is about 1.0 by 1.3 mm.
- - - - - - - - - - - - - - - - - - - - - - - - - - - - - - - - - - - - - - - - - - - - -
The large cascade, shown in Figures 3 and 4, already had a smalled and shallower tracks. In Figure 17 one can see some tracks from that cluster, after additional 5 hours of
etching. They seem to be even more shallow (less dark) than before. The figure 17 shows an island of pits which I did not see before. I would not count them as tracks. But
what are they? I saw several little island of such “foam” today. In any case, this question belongs to speculations; our task, at this stage is to either agree or disagree
on reproducibility. What is reproducible and what is not? It is a waste of time to speculate about things which might turn out not to be reproducible.
- - - - - - - - - - - - - - -
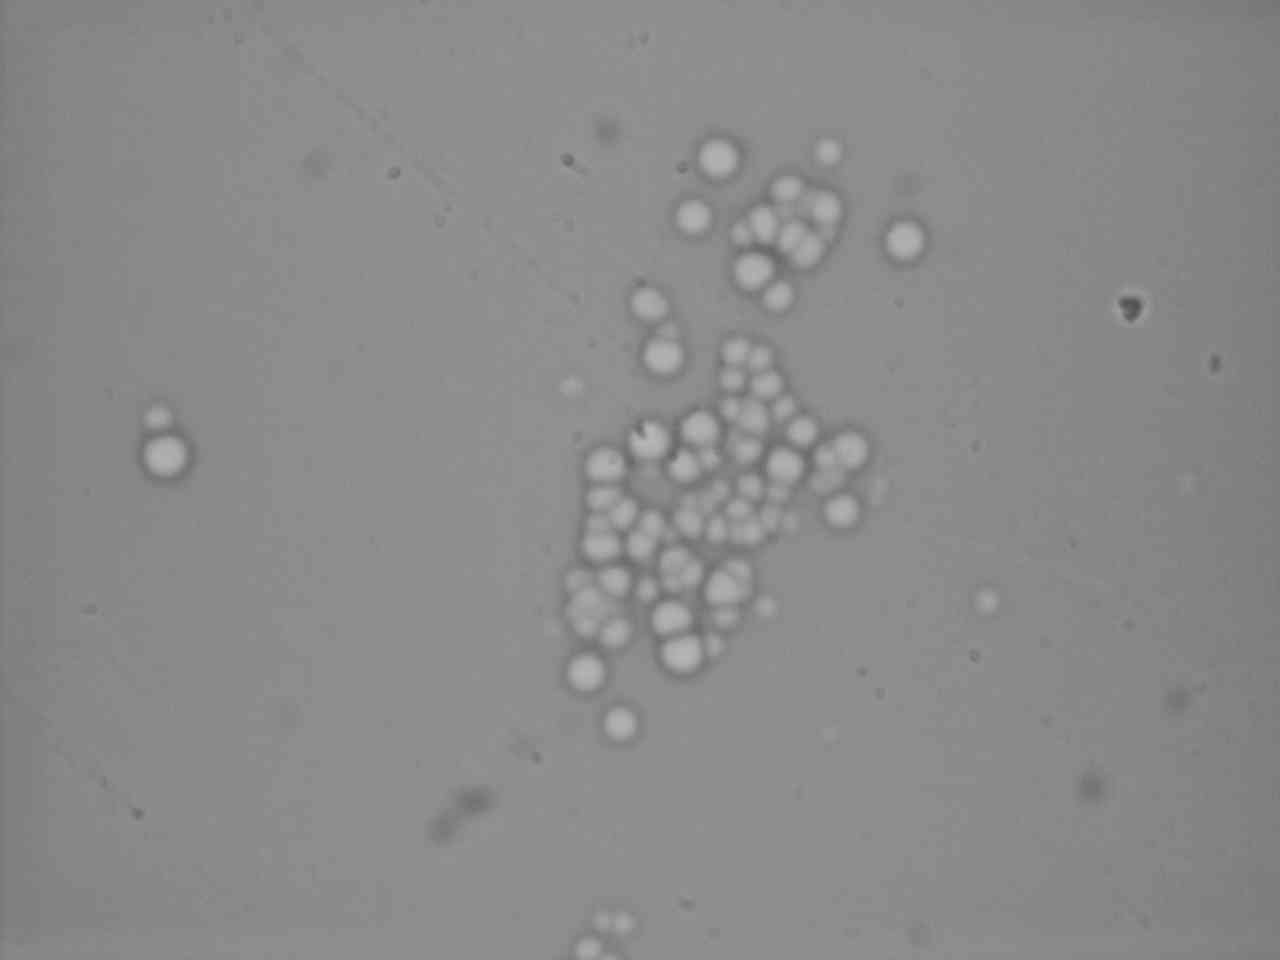
Figure 17
An island of very shallow pits that are very close to each other. Magnification 200. The field shown is about 0.2 by 0.26 mm.
- - - - - - - - - - - - - - - - - - - - - - - - - - - - - - - - - - - - - - - - - - - - -
A smaller island of very shallow pits is shown in the Figure 18.
- - - - - - - - - - - - - - -
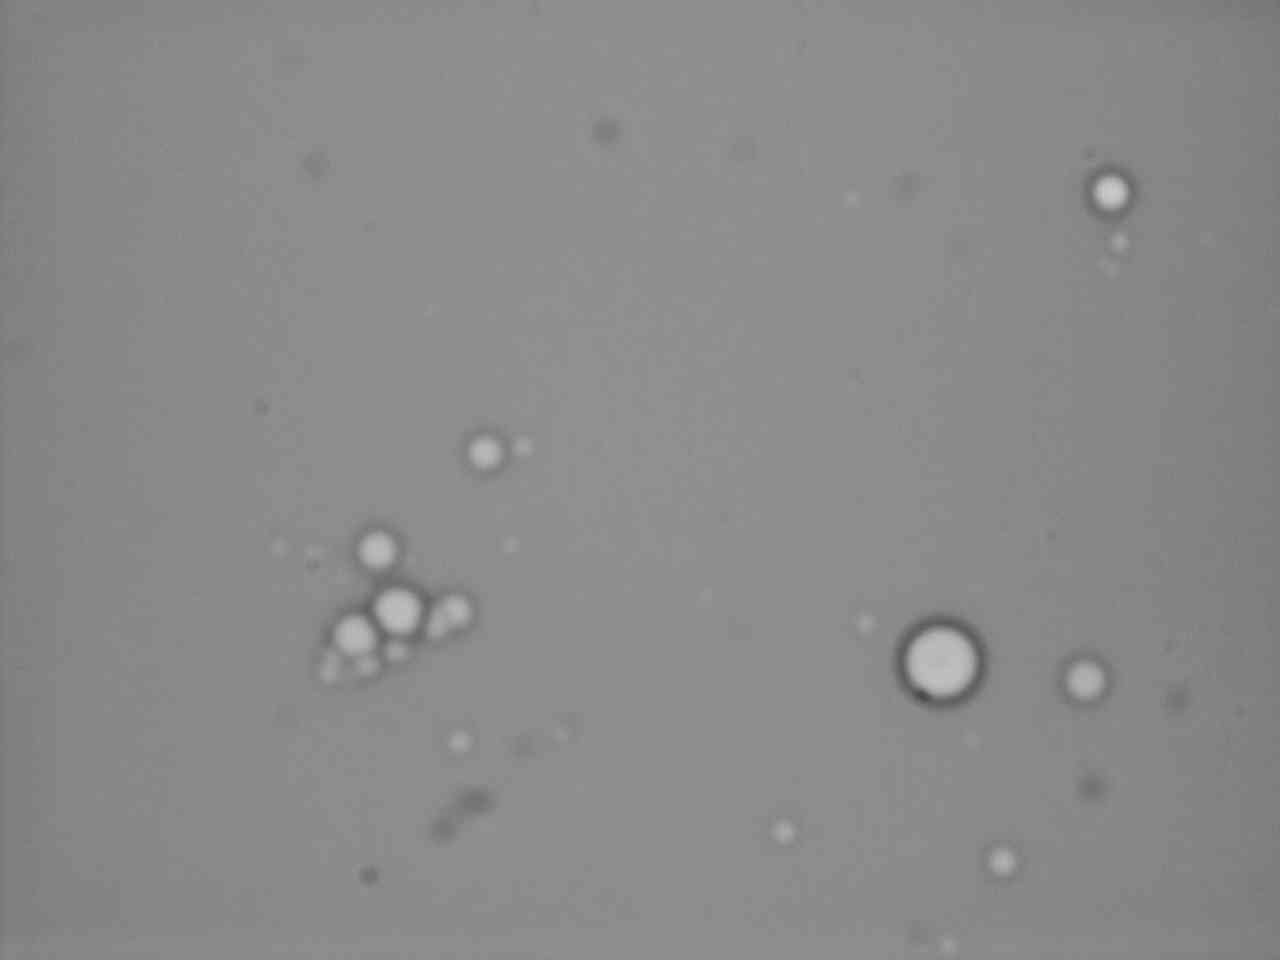
Figure 18
Another island of very shallow pits that are very close to each other. The field shown is about 0.2 by 0.26 mm. Magnification 200. At that magnification, pits due to
alpha particles would be about two times larger than the largest pits below (toward the lower right corner). And they would have dark boundaries, as in Figure 14.
- - - - - - - - - - - - - - - - - - - - - - - - - - - - - - - - - - - - - - - - - - - - -
Pits like those shown in the last two figures will not be counted when the CR-39 chips, from the experiment #2, are examined tomorrow. Keep in mind, in comparing pictures
with each others, that the level of focusing and the level of illumination effect peak appearences. I am glad that Marissa found two large clusters. How many will I
find tomorrow? The large chip will be easier to work with because it is not twisted. So I will not have to constantly refocus when the chip is scanned.
59) Other replications: Marissa Little also finished two experiments and clusters were observed in each of them. Preliminary results, and pictures, are already
in her electronic logbook at:
http://www.earthtech.org/PACA/logbook.html
= = = = = = = = = = = = = = = = = = = = = = = = = = = = = = = = = = = = =
60) My three experiments were #1 (5 days of electrolysis) #2 (21 days of electrolysis) and #3 (it has been running for over 2 days so far). The five chips from the
experiment #2 ( their locatios are shown in Figure 8 above) have been etched yesterday. Today I examined these chips. Figure 18 shows tracks of alpha particles, from the
little corner of my large chip.
- - - - - - - - - - - - - - -
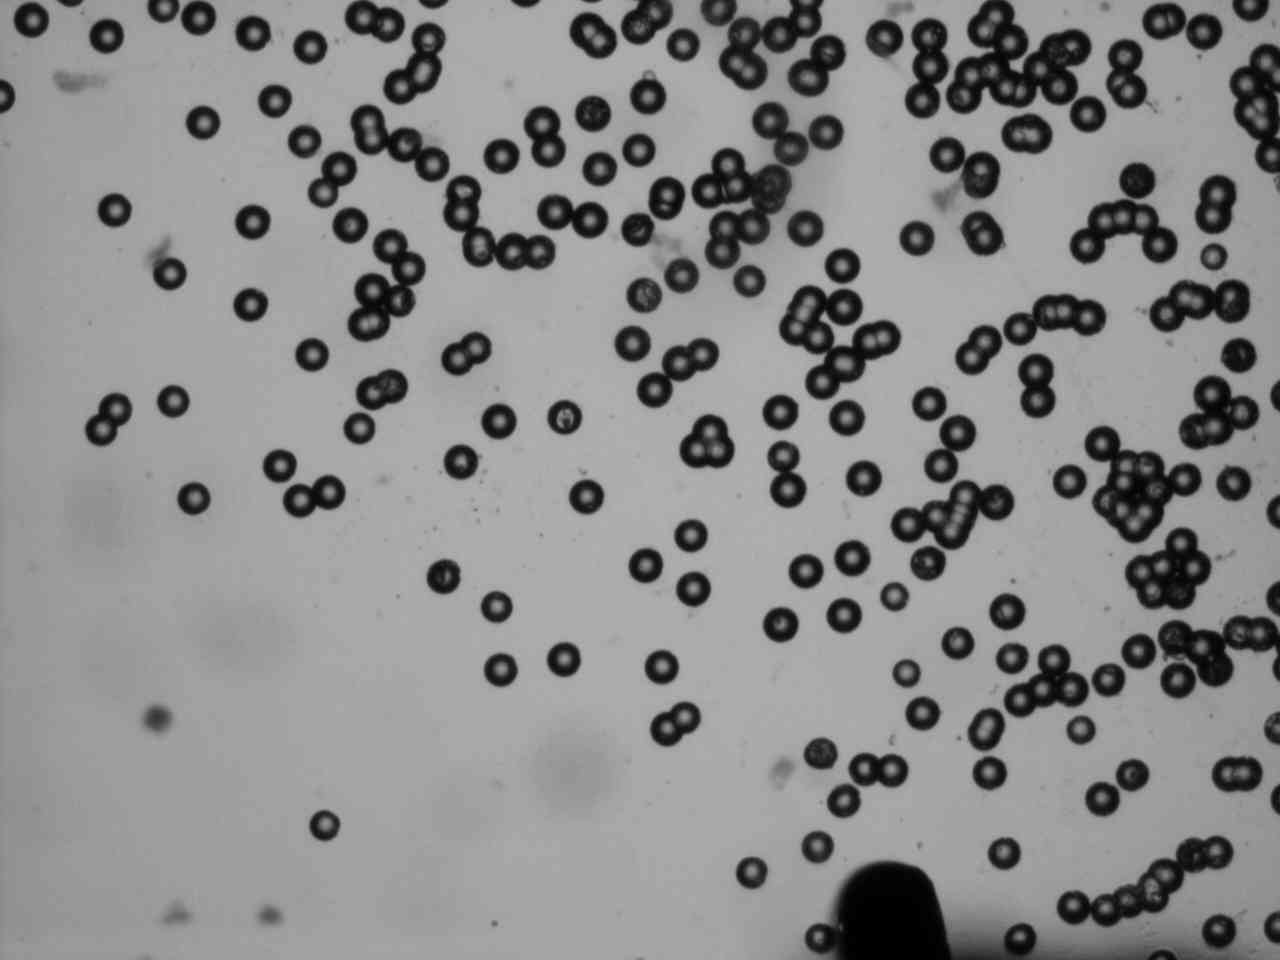
Figure 19
Tracks of alpha particles from Am-241 after 6 hours of etching. Magnification 40. The field shown is about 1.0 by 1.3 mm.
- - - - - - - - - - - - - - - - - - - - - - - - - - - - - - - - - - - - - - - - - - - - -
Figure 20 shows the largest cluster I found. It has about 80 tracks. The average track density, over the field shown in this figure is 80/0.013= 6154 tracks per cm^2.
The average background density is known to be close to 15 tr/cm^2.
- - - - - - - - - - - - - - -
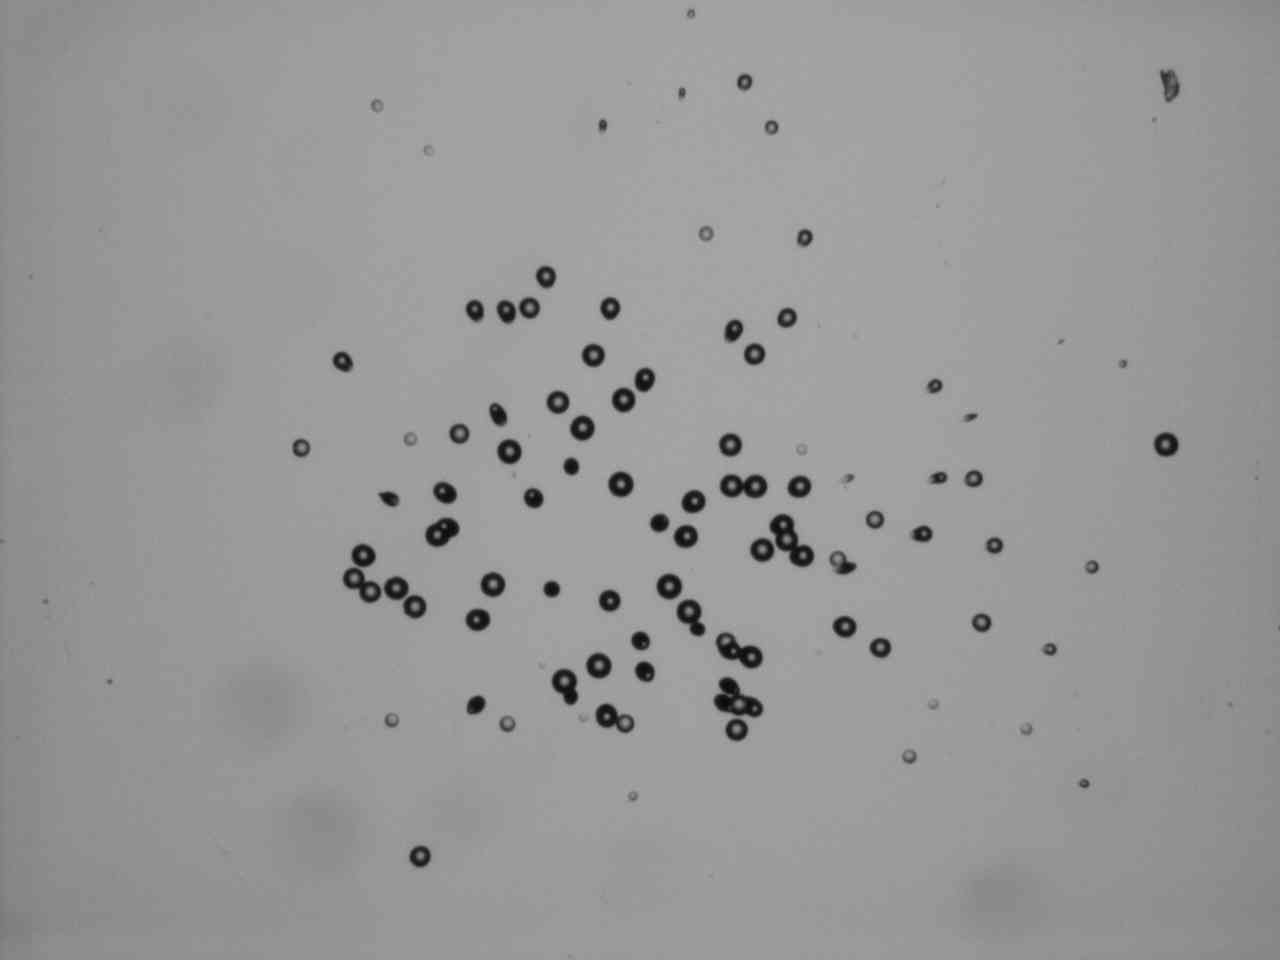
Figure 20
A cluster of about 80 tracks. Magnification 40. The field shown is about 1.0 by 1.3 mm. This cluster was found on the side of CR-39 chip that was facing down (away from the
electrolyte). I looked at the corresponding circular field above it (the field looking up) and found only two tracks, on the field periffery. Visually seen circular fields
have diameters close to 5mm, their areas are 3.7 times larger than areas of rectangular fields of the camera.
- - - - - - - - - - - - - - - - - - - - - - - - - - - - - - - - - - - - - - - - - - - - -
Figure 21 shows a small cluster. Many more such clusters could be found. In this case one has 7 tracks on the area of 1.3 mm^2. This translates into 7/0.013= 538
tracks per cm^2. That is nearly 40 times higher than the mean background density.
- - - - - - - - - - - - - - -
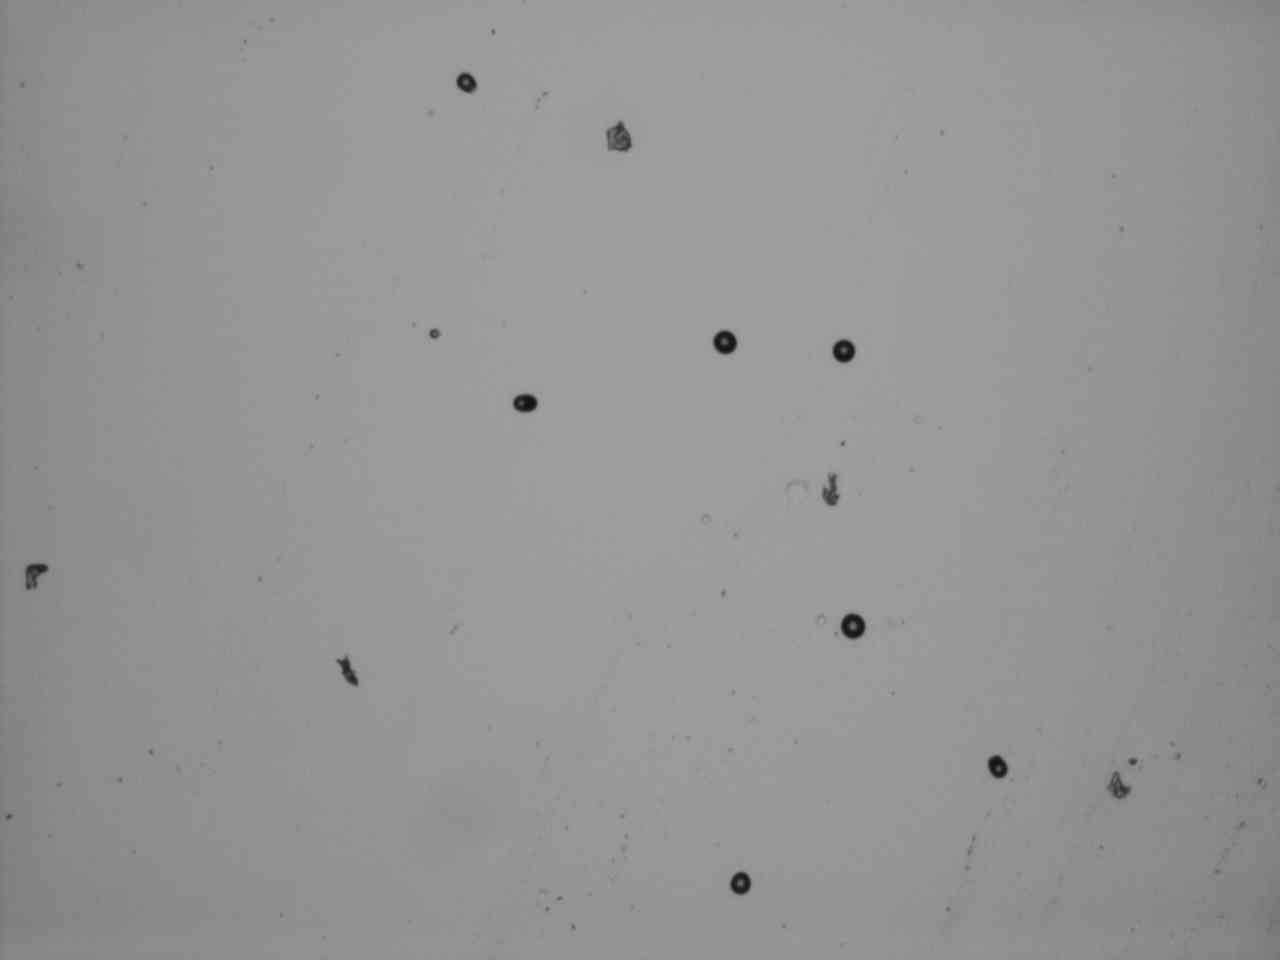
Figure 21
Tracks of a small cluster. Magnification 40. The field shown is about 1.0 by 1.3 mm. The local field density, 538 tr/cm^2 is still much higher than in the
background (15 tr/cm^2). Clusters with small number of tracks, like the one above, could be found on each side of the chip.
- - - - - - - - - - - - - - - - - - - - - - - - - - - - - - - - - - - - - - - - - - - - -
Note that diameters of pits in clusters are about two times smaller than the diameters at tracks due to alpha particles from Am-241. This is probably significant.
I wish the exposure to alpha particles (at the corner of my large CR-39) had been done before the electrolysis and not after it. For the time being this issue should
probably be ignored. Our goal is to establish reproducibility of clusters. Each experiment, so far, confirms Oriani’s claim. In that sense, great progress was made
in recent weeks. Figures 22 and 23 show a cluster that occupies two fields.
- - - - - - - - - - - - - - -
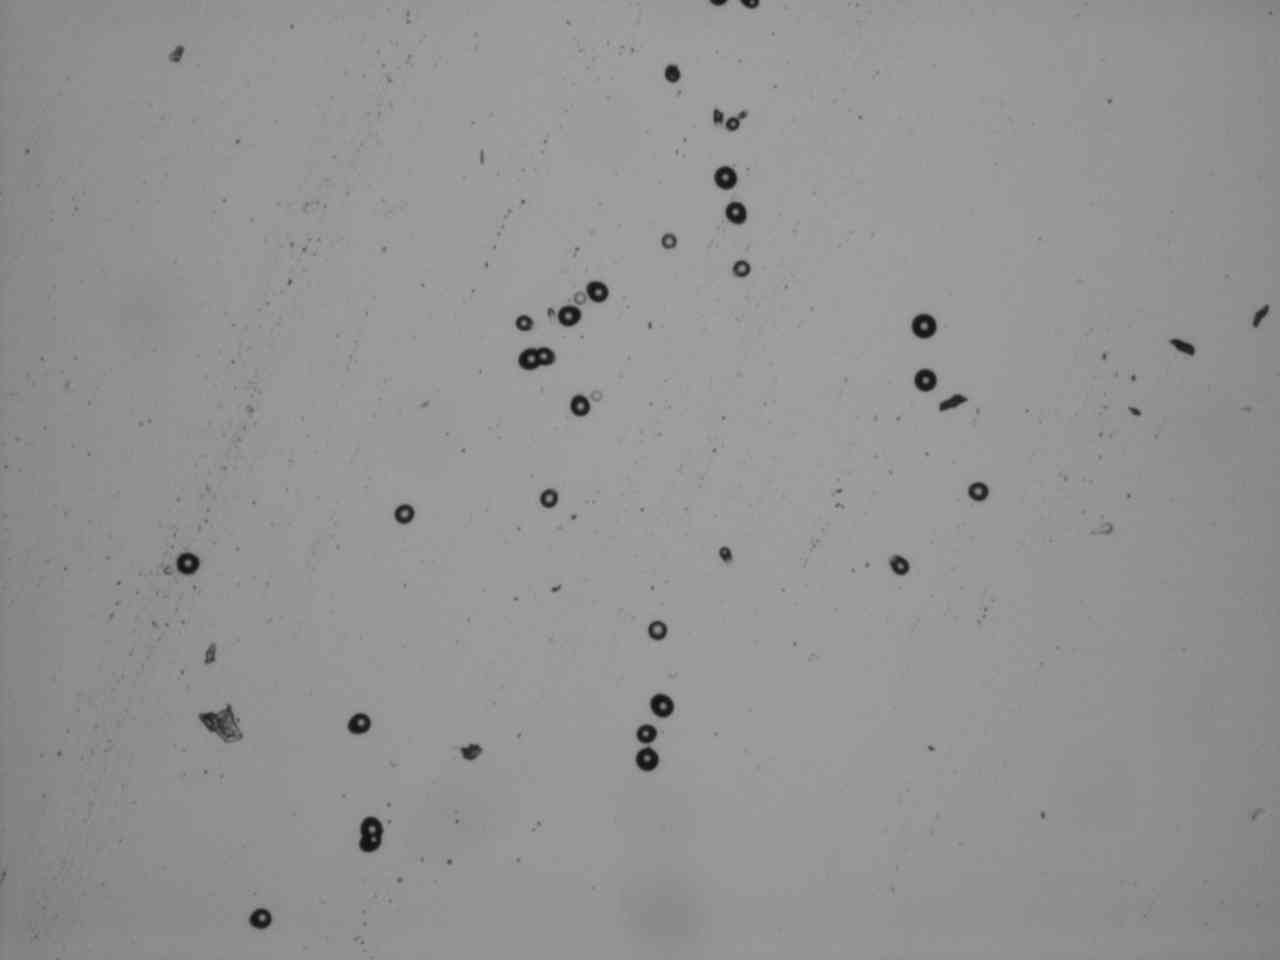
Figure 22
Lower part of a cluster (27 pits). Magnification 40. The field shown is about 1.0 by 1.3 mm. This cluster was found on the side facing the electrolyte. The circular
field below it (the field facing away from the electrolyte) had zero tracks.
- - - - - - - - - - - - - - - - - - - - - - - - - - - - - - - - - - - - - - - - - - - - -
Some tracks can be seen on both figures.
- - - - - - - - - - - - - - -
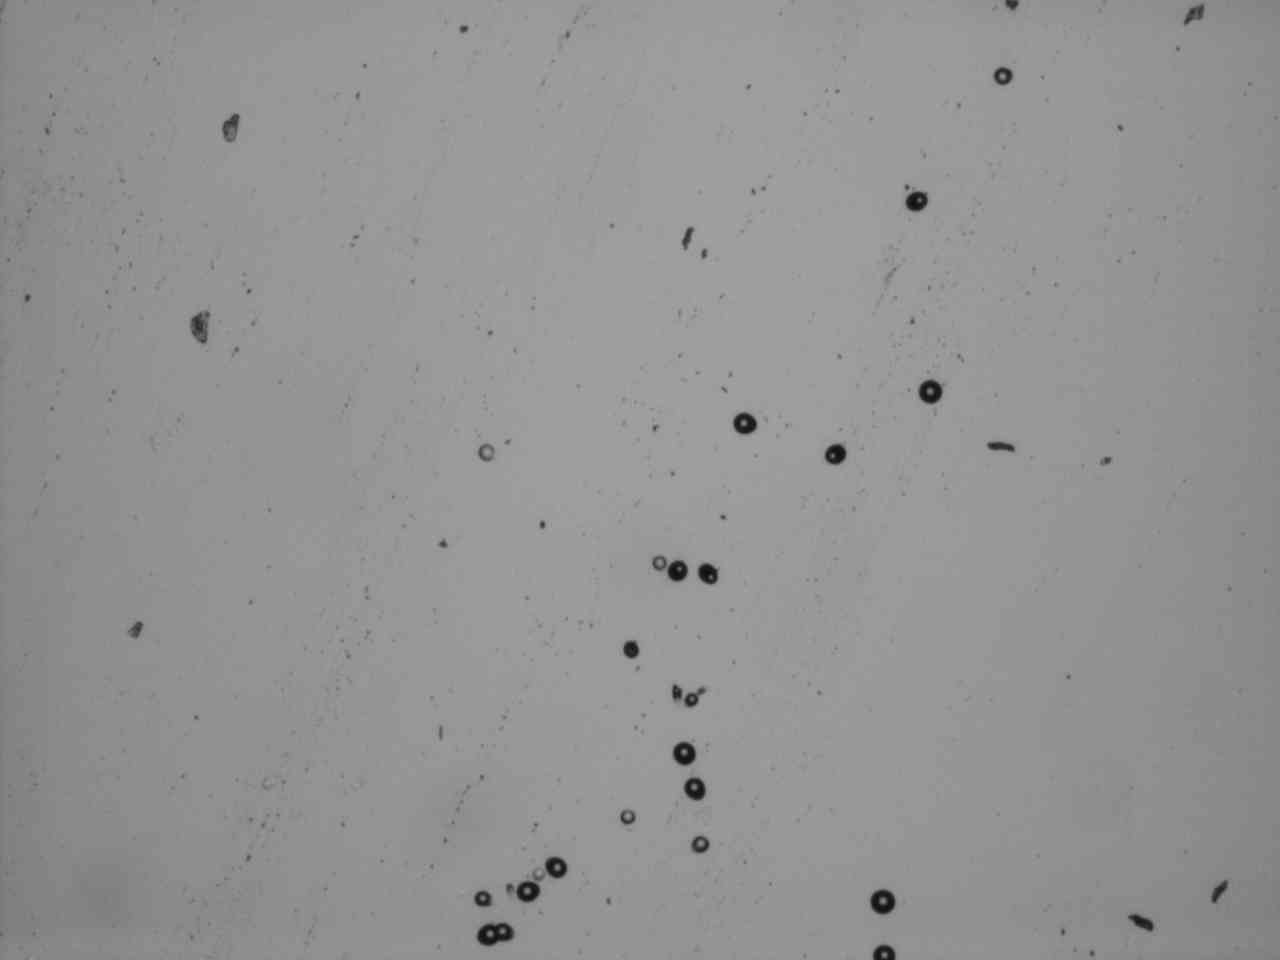
Figure 23
Seven additional pits of the cluster shown in Figure 22 can be seen in the upper part of this figure. Magnification 40. The field shown is about 1.0 by 1.3 mm.
This cluster was found on the side facing the electrolyte. The circular field below it (the field facing away from the electrolyte) had one track.
- - - - - - - - - - - - - - - - - - - - - - - - - - - - - - - - - - - - - - - - - - - - -
Figure 24 shows a mini-cluster, similar to that of Marissa.
- - - - - - - - - - - - - - -
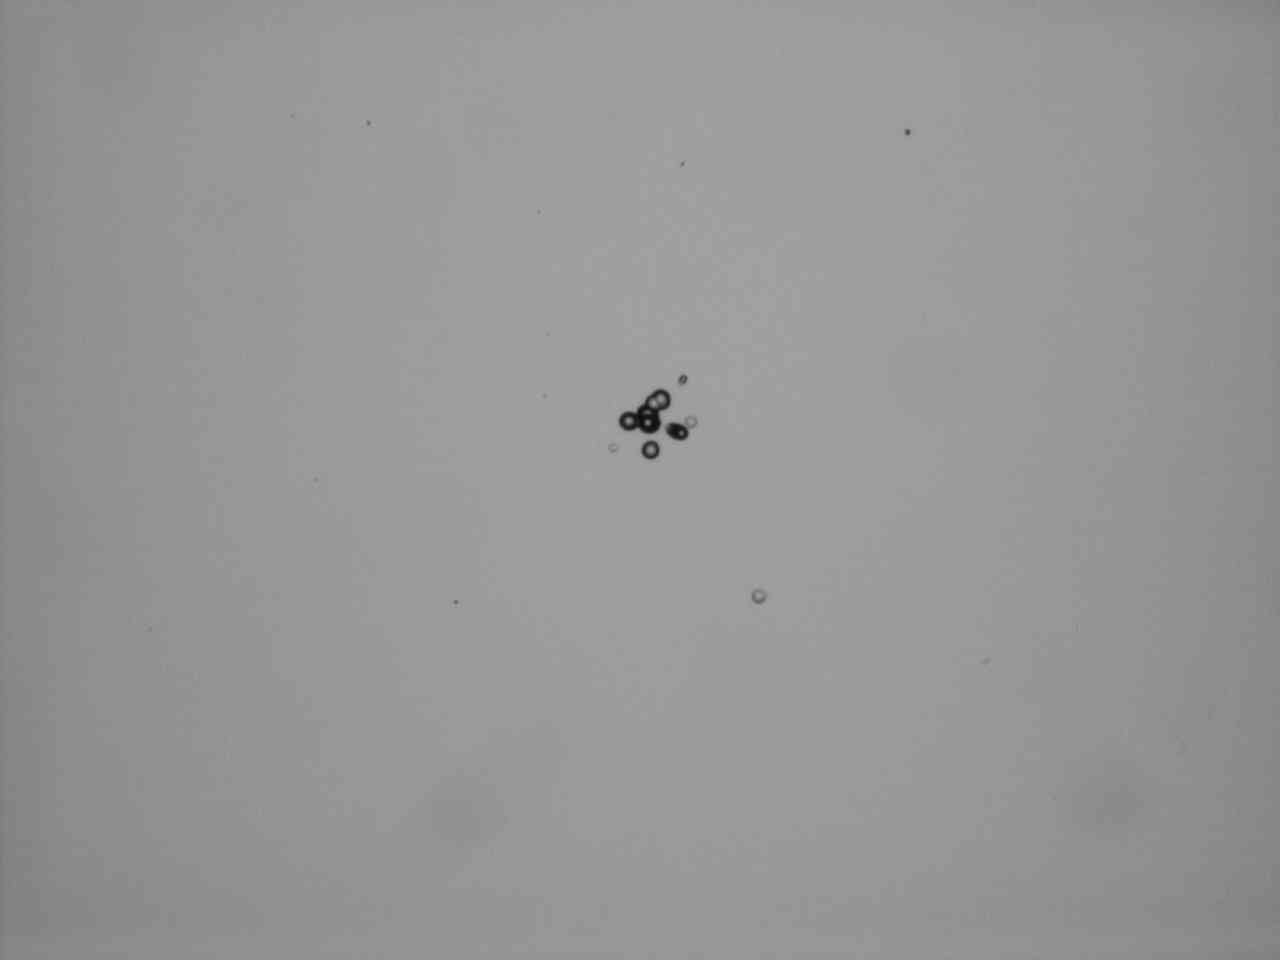
Figure 24
A tiny cluster. Magnification 40. The field shown is about 1.0 by 1.3 mm. This cluster was found on the side facing the electrolyte. The circular field below it
(the field facing away from the electrolyte) had zero tracks.
- - - - - - - - - - - - - - - - - - - - - - - - - - - - - - - - - - - - - - - - - - - - -
Figure 25 shows the same mini-cluser under a five times larger magnification.
- - - - - - - - - - - - - - -
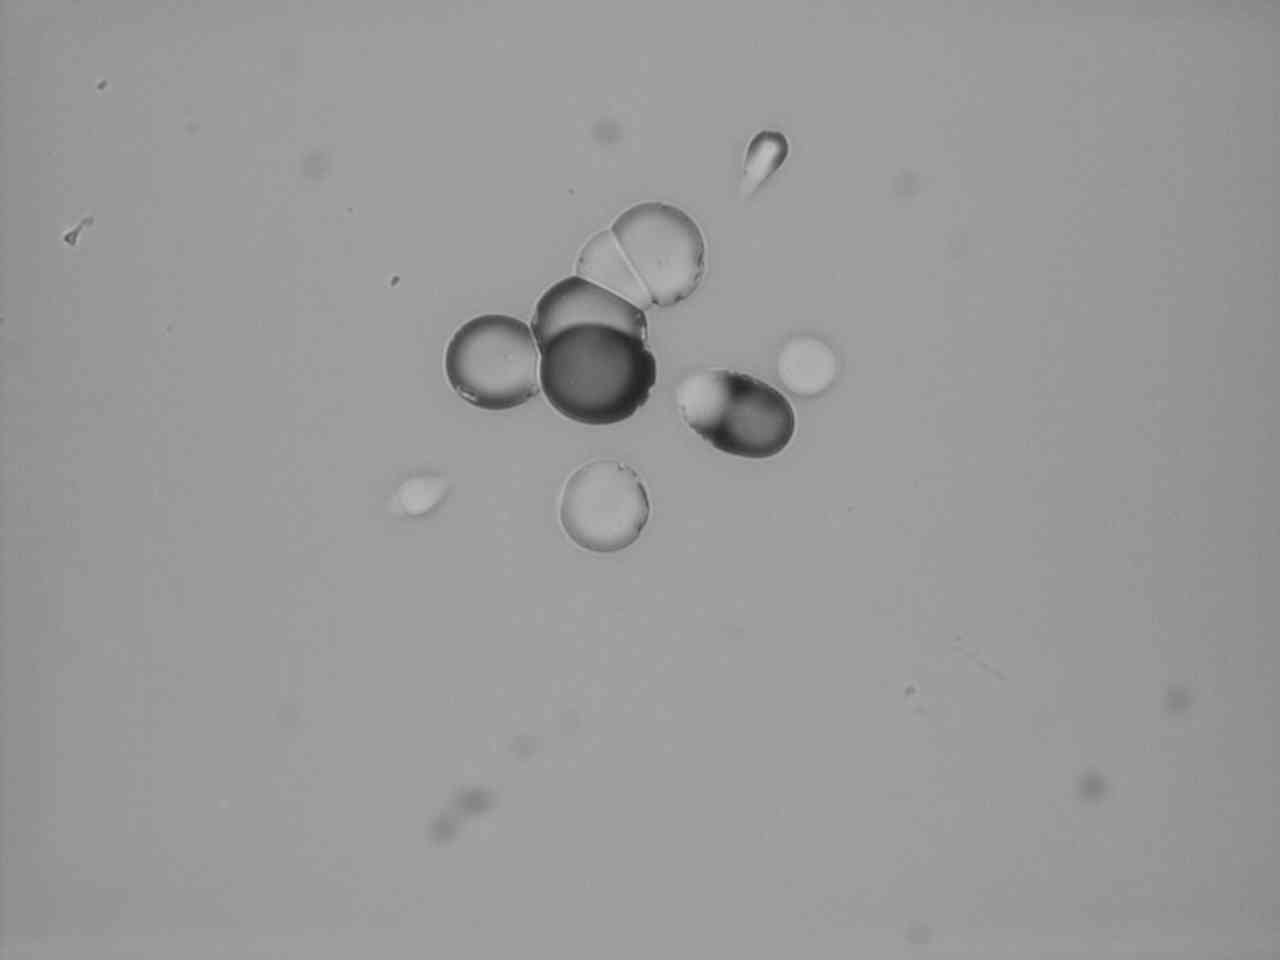
Figure 25
A tiny cluster. Magnification 200. The field shown is about 0.2 by 0.26 mm. This cluster was found on the side facing the electrolyte.
- - - - - - - - - - - - - - - - - - - - - - - - - - - - - - - - - - - - - - - - - - - - -
No clusters were found on four smaller chips, placed as shown in Figure 8. The numbers of tracks on 8 surfaces of these chips (each 2 by 0.9 cm) are shown below.
41 tracks on Surface 1
22 tracks on Surface 2
36 tracks on Surface 3
34 tracks on Surface 4
35 tracks on Surface 5
32 tracks on Surface 6
33 tracks on Surface 7
26 tracks on Surface 8
These results are similar to the background, measured by Richard (who sent me the chips). The sum of tracks on both sides of the large chip, excluding those that
belong to large clusters, turned out to be 396. The exclusion process was subjective. Dividing this sum by 2*9 cm^2 one gets 22 tacks per cm^2. This is not
significantly larger than the expected background of 15 tracks per cm^2. Part of the difference might be due to small clusters (that were not excluded) but this
cannot be taken for granted. Note that local track densities within some clusters, as in Figure 19, are orders of magnitude higher than in the background. For that
reason we should emphasize clusters and not mean track densities (which include clusters). This reminds me of a famous saying attributed to E. Rutherford -- “if your
experiment needs statistics, you ought to do a better experiment.” Clusters will be easier to sell than mean densities.
61) June 1, 2007
Experiment #2, that lasted 21 days, did not produce many more clusters that the experiment #1, that lasted only 5 days. Prompted by Richard and Marissa, I decided
to end the experiment #3 after only four days of electrolysis, and to start experiment #4.
62) June 2, 2007
Experiment #3 was stoped at 15:50 today (after 95 hours of electrolysis at I=41 mA ). That was only one hour less than 4 days. Once again some moisture was found on
the CR-39 that was supposed to be protected from the electrolyte. The mylar had no rupture but the imprit of the spiral nickel cathode (the foot) was clearly visible.
That is where, I suspect, was the leakage. Instead of starting experiment #4 at once I removed the O-rings and applied the CR-39 chips to them. Motivation for this
was in what I know about Oriani’s results (a lot of tracks below the rings), and in what was reported by Marissa yesterday (also excessive track below the ring).
Figure 26 is very crude schematic representation of my O-ring testing arrangement. The two removed O-rings are labeled as Q and P while four 2 by 1 cm chips are
labeled as A, B, C, and D. In the cell from which the two O-rings were removed the ring P was below the ring Q, as illustrated. The chip A stayed below the ring Q
for 24 hours, the chips C and D stayed above the ring P for 24 hours, while chip B stayed between the two rings for 24 hours. The chip E has three areas. During the
first 8 hours first area was between the two rings, during the second 8 hours the second area was between the two rings, and diring the last 8 hours the third are
was between the two rings. This was accomplished by sliding the chip E from one position to another.
- - - - - - - - - - - - - - -
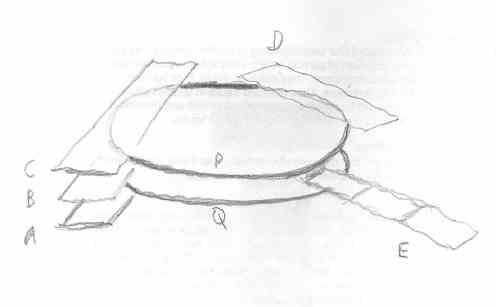
Figure 26
A tiny cluster. Magnification 200. The field shown is about 0.2 by 0.26 mm. This cluster was found on the side facing the electrolyte.
- - - - - - - - - - - - - - - - - - - - - - - - - - - - - - - - - - - - - - - - - - - - -
Chips A, B, C and D are the same as those shown in Figure 8; they were used in experiment #2. I know that the average number of pits per surface, after the experiment
#2, was 32. The chip E on the other hand was never used; it was the last one from a set sent to me by Pamela Boss. The expected background is 15 pits per surface.
63) Uranium dust?
Marissa's website:
http://www.earthtech.org/PACA/logbook.html
shows what happens when alpha-radioactive dust particles are deposited on the CR-39 surface. Each dust particle creates a set of tracks similar to our clusters.
It might mean that the NAE created during the electrolysis is not deposited uniformly over the O-ring surfaces. But it can also mean that some kind of radioactive
contamination, for example uranium or radium, is present on seeded rings sent to us by Oriani. If this were the case then a “seeded” ring would remain “seeded” for
a very long time. Oriani wrote that seeded pieces loose their potency after several days. That seems to rule out uranium or radium. What about Rn-222 whose half-life
is 3.8 days, or Po-218 which is constantly recreated from Rn-222 at the rate of 3.8 days? There are several such possibilities, such as Ra-224, Po-216, Bi-212 and
Po-212. My ongoing test (see Figure 26 above) could be repeated but with time intervals longer than 8 hours. But a silicon detector would be a much better tool for
this kind of investigations. It would show which isotopes are present and in what relative amounts (on the basis of energies and half-lives).
64) June 3, 2007
Chip E has just been moved to the third (last) position. The field that was on the right side in Figure 26 is now between the two O-rings. The test will end in 8
hours and the experiment #4 will be started. Meanwhile I was thinking about the radon-like contamination again. Which experimental facts is it consistent with and
which facts are not consistent with it?
a) Experiment #2 lasted four times longer that experiment #1. But it did not produce about four times more large clusters. The might be interpreted as an indication
of the radon-like effect. Clusters are due to dust particles whose alpha radioactivity goes down exponentially with the half-life of several days.
b) If that interpretation is valid then I should see even smaller number of large clusters in the experiment #4. After all, it will be started 27 days after the
O-rings were received. Perhaps experiment #4 should also last several weeks. If clusters are due to original contamination with something that decays like radon
then the experiment #5, stared two months after the experiment #1, should have no clusters at all. On the other hand, I should still observe large clusters, in the
experiment #5, if they are due to something alpha-radioactive that is recreated in the cell during the electrolysis.
c) Oriani did observe large clusters in about twenty consecutive experiments, each lasting about 4 days. That would be a good argument that clusters are due to a
nuclear process induced by electrolysis, provided one can be sure O-rings are not recontaminated with radon-like something, after each experiment. It would be
interesting to know how many clusters were actually observed after each of his experiments. Fortunately, his CR-39 pieces contain this information. I am sure
Richard keeps them well organized and labeled.
d) In a private message received today, someone wrote that an X-rays film could be used below the CR-39 chips during Oriani-type experiments. “ If you see any
pattern in the fogging that matches the damage (pits) in the CR39, it will be very difficult to explain the pits as chemical or mechanically induced artifacts.”
Logically this makes sense. But the X-ray film is not sensitive enough, unless one wants to detect millions of photons. Using thick nuclear emulsions, instead of
CR-39 chips, could be useful. But this is not trivial. In any case, I have no experience in working with thick nuclear emulsions. Silicon detectors would be
much more appropriate replacement for our chips.
65) The 24-hours-long test ended and the experiment #4 started at 16:30 (6/3/07).
Nothing is different in comparison with the experiment #3, except the
cathode wire was slightly reshaped, to make sure the center column (in the heat shrink) is not the lowest point of the foot. I am concerned about the moisture.
The nuts were turned a little tighter. I will now start etching all five chips used in this test, and three chips used in the experiment #3. The large chip (3
by 3 cm) used in the experiment #3 was squeezed between the O-rings while two small chips (2 by 0.9 cm), used in this experiment, were in the air, outside the
cell. As in the experiment #2, they were slightly above the plane of the main chip (say 3 mm). One of them was 45 to 65 mm from the cell axis and another
was 75 to 95 mm from the axis.
Only one large CR-39 is used in the experiment #4; it is my last CR-39 piece. New 6 micron mylar is used in experiment #4. And the exposure to Am-241, at the
little corner, took place before the electrolysis. Before etching I will expose another corner as well. This might become important in comparing sizes of
post-electrolysis pits with sizes of pits due to alpha particles from my Am-241. Starting voltages 12.1 V on the power supply and 6.4 V on the cell (because
I am using 41 mA current regulator, as in experiment #3).
Click to see the list of links