Click to see the list of links
333) Richard's paper has been submitted to Physical Review C
Ludwik Kowalski (11/6/07)
When I was working on unit #335 (a paper describing my clusters) Richard Oriani submitted a paper to Physical Review C. This unit is a replacement of the draft of
Oriani's paper that was posted here for several months. Unfortunately, the manuscript was rejected out of hand by the Editor without its being submitted to reviewers.
Note that figures and tables are below the main text.
--------------------------------------
Repeatable technique for the generation of a nuclear reaction during electrolysis
R.A Oriani
University of Minnesota, 151 Amundson Hall, 421 Washington Ave SE, Minneapolis MN 55455 email: orian001@umn.edu
Received 09/24/07
Abstract
A relatively simple technique using CR39 particle detectors has been developed that in 25 consecutive electrolyses has reproducibly produced charged particle
tracks, showing unambiguous evidence of a nuclear reaction during electrolysis of heavy or light water solutions. Nuclear tracks can be produced upon the surface
and beyond the 1 mm thickness of the CR39 detectors. Nuclear activity of some sort can persist in the Viton o-rings used in the electrolysis cell so that
charged energetic particles can be generated subsequently without electrolysis.
I. INTRODUCTION
Since the ill-fated announcement by Fleischmann and Pons [1] that a nuclear reaction can take place during electrolysis of a solution of lithium sulfate in heavy water
much work has been done in attempts to confirm the claim. Papers have been published that show the production of tritium, of 4He, of the production of thermal
energy far in excess of the inputted electrical energy, and the transmutation of some elements; see [2] for a review. These efforts have been met by assertions from
the nuclear community of experimental error or naiveté, or accusations of fraud and deception. There are two main reasons for this repudiation: the claimed
phenomena can not be understood in terms of currently accepted nuclear theory, and the lack of reproducibility of the phenomena. Any one experimenter cannot produce
the claimed phenomenon on demand, and another experimenter often can not replicate the results.
Recognition of the latter difficulty has motivated the search for an experimental technique that is as transparent, simple, and irrefutable as possible to try to prove
that electrolysis can be accompanied by a nuclear reaction, despite current understanding in nuclear physics. Energetic charged particles and very energetic neutrons
can be detected and recorded by a high polymeric material called CR39, and its use is well known to the nuclear community [3]. A nuclear particle upon entering the
plastic leaves a trail of disrupted chemical bonds which are more easily chemically attacked than undamaged material. The pit that results from etching by concentrated
alkali solution is unambiguous evidence that a nuclear reaction had occurred, since only particles of energies of 0.5 MeV or more can damage the bonds sufficiently to
leave an etchable trail. Such energies are much larger than can be provided by chemical reactions.
The integrating character and the relative simplicity of this technique have led the writer to apply it to the problem. Control, or blank, experiments are necessary
because radon in the air and the occasional cosmic ray produce etchable damage trails in CR39 detectors. Past work with this method in this laboratory has included
immersion of CR39 chips in electrolyte solution, suspension of the chips in the vapor above the solution, placement of chips in air just below the metal plate that
serves both as cathode and as the bottom of the electrolyte compartment, and placement of chips in air just outside of the glass cell, with each of these configurations
maintained during electrolysis. From the numbers of nuclear tracks on the detector chips used in the electrolyses and those on chips used as controls can be calculated
the probability, P, that the two sets of numbers belong to the same population, ie., that electrolysis has no effect on the number of pits. The results of prior
research [4,5] are as follows. For detector chips immersed in H2O/Li2SO4 electrolyte and Pd as cathode P = 1.2*10-6,
and with Ni as cathode P = 5.8*10-4. With D2O/Li2SO4 and Pd as cathode P = 2.5*10-5. With detector chips
suspended in the vapor over H2O/Li2SO4 electrolyte and Ni or Pd as cathode material P = 3.0*10-10. Although these results
reasonably demonstrate that electrolysis can indeed generate energetic nuclear particles, it cannot be claimed that every electrolysis experiment will produce the
nuclear reaction since the data sets for the electrolysis chips and the control chips partially overlap. Consistent reproducibility has not been achieved despite
having kept constant all the controllable parameters. Therefore a different experimental approach has been adopted.
II. EXPERIMENTAL DETAILS
Investigators [6] at the SPAWAR Systems Center, San Diego, California, initiated the strategy of having the cathode and the CR39 chip in very close proximity. The
metal wire serving as cathode was wound tightly around the detector chip. Unfortunately, this configuration produced copious chemical attacks on the detector by ions
generated at the cathode. The huge number of chemical pits produced made it very difficult to ascertain the generation of nuclear pits. To maintain the desirable
nearness of cathode to detector while avoiding the chemical attack, the obvious modification is the interposition of a thin Mylar film between the electrolyte and the
detector chip. Preliminary experiments showed that 6 _ Mylar film permits the passage of nuclear particles emitted by pitchblende, energies of 4.1 to 5.8 MeV.
The cell design adopted is shown in Fig. 1. Squares, roughly 3cm x 3cm, of CR39 cut from a sheet supplied by the Landauer Corp. are overlaid by 6 microns Mylar foils
obtained from Cemplex Industries, Inc., and the combination is pressed between Viton o-rings that fit into grooves in the glass o-ring joints purchased from Fisher
Scientific Corp. The joint is held together by a pinch clamp. The anode is a platinum wire whose lower end forms a loop parallel to the plane of the detector chip.
The cathode is usually a nickel wire whose lower end is bent into a shape like a W the plane of which is parallel to the plane of the detector square. The vertical
portion of the nickel wire is sheathed in heat-shrinkable plastic tubing and spot-welded to a titanium rod inserted into a glass tube. The electrode assembly is held
together by a rubber stopper through which a hole permits the escape of the gases produced by the electrolysis. This describes the electrolysis cell designated by S.
Another cell designated by B differs from the S-cell only in that the platinum anode wire ends in a crude spiral the plane of which is perpendicular to the detector
chip.
The current to cell-S is supplied and controlled by a potentiostat, and that to cell-B by a constant-current power supply. To begin an experiment a square of CR39 is
cut from the sheet from the manufacturer, a small hole is drilled at a corner of the detector square to accommodate a wire for the subsequent suspension of the chip,
and an identification symbol is inscribed at another corner. The surface on which the identifier is scratched is referred to as the front surface, and is the surface
upon which the Mylar film is laid after the manufacturer-supplied blue film that protects the detector is removed. After the detector with its overlying Mylar film
is clamped in the o-ring joint about 10 ml of electrolyte solution are poured into the cell and the electrode assembly is put into place. The cathode is then lowered
carefully by sliding the supporting titanium rod within the supporting glass tube until the W-shaped foot of the cathode rests upon the Mylar film. Electrolysis is
then started and the current is either kept constant for the entire duration of the electrolysis, or is increased once per day.
The electrolyte employed was usually of distilled H2O with 0.022 g Li2SO4 per ml. To provide a comparison with the results of ref. 6
the first two experiments were done with silver cathodes in electrolytes of D2O with LiCl plus PdCl2. Water was not added during electrolysis to
compensate for its loss by dissociation. Four days of electrolysis were the usual duration after which the cell was disassembled and the detector chip removed and washed.
There was never any trace of pitting or abrasion on the detector plastic before etching. Stirred 6.5 M sodium hydroxide was the etching solution, held at about 70 C for
about six hours. This was followed by examination at 100X and 500X, applying experience with pits produced by exposure of CR39 to 241Am and to pitchblende to
distinguish nuclear pits from artifacts caused by manufacturing defects in the detector plastic. The nuclear pits were counted on the front and rear surfaces of the
detector chips within the outer perimeter of the o-rings, amounting to 4.5 cm2. This procedure eliminated the counting of tracks that may have been produced
by air-borne radon during the duration of electrolysis.
Control experiments of four kinds were carried out to account for the nuclear tracks already present in the detector as received from the supplier, as well as those
produced during the entire experimental process caused by radon in the air, in the electrolyte, in the etching solution, and in the wash water. The control detector
chips were handled in exactly the same way as were the experimental chips except that instead of being used in electrolysis they were either wrapped in Mylar film,
immersed in stock electrolyte solution, pressed against as-received o-rings, or mounted in a newly constructed cell fitted with unused electrodes, electrolyte, Mylar
film and stoppers, but in the absence of electrolysis. In each instance the same length of time as the duration of the electrolysis experiment was applied. The number
density of tracks in the as-received detector sheet varies from one shipment to another, and is not a constant over any one sheet. Therefore it is appropriate to
compare an experimental value of track number density to the mean value for the controls. The results for the controls are presented in Table I.
Consideration has been given to the possibility that the features seen after etching might have been caused by processes other than the alleged nuclear reaction. For
example, radioactive dust particles floating in the laboratory air may adventitiously settle upon a detector chip and produce nuclear tracks. This possible problem
has been examined by placing fine particles of pitchblende upon detector chips. Examination after etching has shown that such particles produce “rosettes”
of tracks (Fig.2). These track configurations, reputedly also produced by cosmic rays, have very occasionally appeared on detector chips during our research. They
were not included in the counting of nuclear tracks. One may suspect that electrostatic charges produced by peeling off the manufacturer-supplied blue protective
plastic film from the CR39 might cause etch pits. This possibility was explored by adhering Scotch tape to a detector chip then peeling it off. After etching nothing
was visible that could be attributed to static charges. However, it is recognized that if, after peeling off an adhering film the bare chip is allowed to remain
exposed to dry air for many hours, the electrostatic charges on the chip will attract daughter products of air-borne radon so that nuclear tracks would be generated.
This was prevented in our work because always immediately after peeling off the protective film the detector chip was mounted in the electrolysis cell.
Manufacturing defects can make it difficult to discriminate between nuclear pits and artifacts. The polymerization process can leave poorly polymerized regions. As
etching proceeds the receding surface of the detector chip intersects with such regions which etch more rapidly than well polymerized material so that pits result.
These pits are usually small, circular, shallow, and most of them appear in groups. They can be distinguished from nuclear pits by the much darker appearance of the
latter in the microscope using illumination from above. Features whose identity remains ambiguous are not counted as nuclear pits. Scratches and other mechanical
insults to the detector chips can also produce ambiguities. This problem was examined by a series of experiments in which various mechanical forces were applied to
chips, followed by etching and examination. Light scratching produces linear arrays of pits usually of uniform diameter. For this reason pits in linear arrays are
never counted as nuclear pits. Pits are not produced by hard pushes against the chip with the point of metal tweezers or with the handle of an Exacta knife. On the
other hand a push with the point of an Exacta blade produces a very dark pit. Rubbing with a plastic rod has no effect, but rubbing with a metal spatula leaves a
faint trace, and rubbing with the point of tweezers produces an etchable trail. But grasping a detector chip with metal tweezers using considerable force does not
leave any effects. This is fortunate because the chips are manipulated with tweezers.
One other type of experiment was in some instances carried out along with the primary experiments. Prompted by the results of previous research [7] that the apparatus
employed for electrolysis appears to retain some kind of nuclear activity, it was decided to investigate whether the o-rings demonstrate this phenomenon. After the
termination of an electrolysis the o-rings were removed and after drying were placed upon a CR39 square, and the whole was wrapped tightly in aluminum foil and stored
for four days. Then the detector was etched and the nuclear tracks counted.
III. RESULTS AND DISCUSSION
Table II displays the results of consecutive electrolysis experiments the primary purpose of which was to validate the technique. The counts of nuclear tracks, either
on the front or on the rear surfaces, (Table II ) are always considerably larger than the counts per unit area for the controls (Table I). In every experiment the
average number density of nuclear tracks found after etching is greater than the mean value for the controls. Hence it can be concluded that the present technique has
consistently produced evidence that a nuclear reaction of some sort has been generated in the course of electrolysis. The present research does not identify the nature
of the nuclear particles that produce the observed tracks, but Lipson et al, [8] claim that the particles are protons and alphas. Also, the present work does not
attempt to establish the connection between the nuclear reaction here manifested and the excess thermal energy reliably measured calorimetrically by several
investigators [2].
A second observation from the results listed in Table II is that tracks are found on both sides of the detector squares, and that often the average track number
density on the surface facing away from the electrolyte is larger than at the surface immediately below the Mylar film. Charged particles that caused the observed
tracks on the rear surfaces could not have been generated at the site of the electrolysis. The 1 mm thickness of the detector square is much too large to be traversed
by charged nuclear particles with the energies established by Lipson et al. This leaves either neutrons of very high energies as the damage trail maker, or some
other neutral particle that subsequently reacts or decays to produce alphas and protons.
It is significant that the nuclear pits are distributed bimodally, both as individual randomly located pits and as dense groups or clusters that are bounded by areas
relatively devoid of nuclear pits. The number densities in clusters are much greater than the mean number densities listed in Table II. The clusters are of two sorts:
one within which the pits are essentially randomly distributed as to position and shape (Fig.3), and one in which the pits of elliptical or conical shape are radially
distributed (Fig.4). Pits of these shapes result when the path of an impinging nuclear particle is other than perpendicular to the surface of the detector. By focusing
the microscope up and down one can determine the direction and sense of the path [3]. Doing this for all of the elliptical and conical pits one can determine that the
nuclear particles that produced those pits emanated from a common origin away from the surface of the detector. In fact, by a careful analysis [9] one can estimate
the distance above the detector surface where the shower of nuclear particles originated. This consideration leads to the surmise that zero-charge precursors, that
themselves originated in the region of electrolysis, reacted with something in the air near the detector or in the Mylar film to generate charged nuclear particles
that produced the nuclear tracks.
Early in the present work it became clear that the number density of nuclear tracks found along the circle of the o-ring was often considerably larger than elsewhere
on the detector chip. Past work [7] had developed weak evidence that nuclear activity can persist after the termination of electrolysis. These two items combined to
motivate exploration of what happens when an o-ring that has been used in an electrolysis experiment is removed from the electrolysis cell and is allowed to lie upon
a new detector square for several days. Table III presents the results of these experiments. Whereas fresh o-rings that have never been used in an electrolysis
experiment produce an average of 16.6 tracks/cm2, once-used o-rings often produce a much larger number of tracks. In some cases the number of tracks is so
great that counting becomes impractical, and the area of largest number density coincides roughly with the circular outline of the o-ring. Figure 5 is an unmagnified
image of an etched detector square after a post-electrolysis o-ring had lain upon it for three days. Figure 6 is a 100X photomicrograph of a small portion of the
circular hazy perimeter shown in Fig. 5. It should be noted that before etching no trace of pits can be seen. Similar circular haze rings, composed of a multitude of
nuclear tracks, have been also found on detector squares used in electrolysis experiments.
The tracks produced by a post-electrolysis o-ring placed upon a CR39 chip cannot have been caused by an ordinary radioactive contaminant in or on the o-ring. First of
all, new unused o-rings produce only small numbers of tracks (Table I). However, there is the possibility that the o-rings become radioactively contaminated during the
preparation or the disassembly of the electrolysis experiment perhaps by contact with laboratory furniture. This idea was explored by two sets of experiments. In the
first set two new, as-received o-rings were suspended in the laboratory air for two days and then rubbed on the top surface of the laboratory bench. After this the
o-rings were placed on detector chips for two days. This procedure resulted in 42.3 and 11.3 tracks/cm2. The first value is for the o-ring suspended in air
near an operating electrolysis cell. In the second set of experiments one side of each of two new, as-received o-rings was rubbed against the top of the laboratory bench
on which many electrolyses had been carried out. The other sides of the two o-rings were not contacted to the laboratory bench. Then, each o-ring was clamped between two
detector chips for two days. After etching the tracks/cm2 found on the chip surfaces that had been in contact with the rubbed sides of the o-rings were 6.8
and 7.1. The two chip surfaces that had been in contact with the unrubbed sides of the two o-rings developed 5.0 and 13.6 tracks/cm2. These results show
that the track densities listed in Table III and displayed in Fig.6 can not be artifacts of contact of the o-rings with radioactive contaminants in the laboratory.
Another unlikely source of radioactive contamination was explored. This is the high-vacuum grease applied to the grooves of the glass joints to facilitate assembly with
the o-rings. Crosses were drawn on one side of each of two detector chips with the grease and one day later the chips were etched and examined. The track densities
found on the greased sides were 11.7 and 13.4 tracks/cm2, whereas on the clean sides the track densities were 11.1 and 9.3. The high-vacuum grease is not a
source of radioactive contamination.
Although the number density of tracks along the perimeter of a post-electrolysis o-ring is larger than that within the area bounded by the circle of the o-ring, the
number density within the circle is often larger than the track density of the controls. Figure 7 shows the etch pits near the center of the area of the detector chip
bounded by the post-electrolysis o-ring that had been laid upon it (experiment number 1 in Table III). The detector area represented by the photomicrograph is about 1
cm away from the o-ring and measures approximately 0.008 cm2, so that the number density of tracks is in the thousands. Furthermore, the largest angle at
which a charged nuclear particle would produce a damage trail in the area of Fig.7 would be made by a particle leaving the o-ring from a point about 2 mm from the
detector surface (see Fig.8). The tangent of this maximum angle would be about 0.2. However, this angle, about 11 degrees, is smaller than the critical angle [3] for
a damage trail to be made visible by etching (about 36 degrees) so that particles coming directly from any part of the o-ring could not cause etch pits at 1 cm
separation from the circle of the o-ring. This argument has been confirmed by the procedure of depositing a light coating of uranium acetate upon an as-received
o-ring, keeping the coated o-ring between two CR39 squares for four days, then etching the detector chips. Examination showed that haze patterns following the
circumference of the o-rings had developed, similar to that illustrated by Fig.5. However, the central regions of the areas bounded by the haze rings were clear.
The track densities were 55 tracks/cm2 on one chip and 70 on the other. These numbers are to be compared with the background value of 55 per cm2 and with
over 2000 tracks /cm2 found in the center of the chip pictured in Fig.5.
That a high density of etch pits can be produced near the center of the overlying o-ring is evidence that the nuclear tracks generated in a post-electrolysis experiment
are not the result of contamination on the o-ring. The residual effect is a real phenomenon. One must conclude that something residing in the o-rings previously used in
electrolysis caused the generation of energetic charged particles near the center of the area, and that these charged particles then impinged upon the detector chip at
angles larger (ie.,closer to the perpendicular) than the critical angle for etching pits.
IV. CONCLUSIONS
Several definite conclusions can be drawn. First, a nuclear reaction can occur during electrolysis. A technique has been developed that consistently produces evidence
of a nuclear phenomenon in the form of nuclear tracks made visible by etching. Second, nuclear tracks can be produced beyond the 1 mm thickness of the plastic detector.
The inference may be made that at the site of electrolysis uncharged particles are created that are the precursors of the energetic charged particles whose damage trails
can be observed after etching the CR39 detectors. It is further inferred that the precursor entity decays or reacts with an element in the air or with an element within
the plastic of the Mylar film to generate charged particles. Third, the neutral precursor particle can persist for an as yet undetermined time in the materials that
constitute the electrolysis cell and can react to produce charged particles in the absence of electrolysis.
Many questions are left unanswered. Chief among these is the nature of the precursor particle. Another important question is the relation between the nuclear reaction made
manifest by the observed nuclear pits in the CR39 and the excess thermal energy that has been measured calorimetrically in other research. It is clear that the thermal
energy deposited by the formation of the charged particles observed in this research is much too small to account for the calorimetrically measured thermal energy.
Much research remains to be done. The aims of the present work have been only to develop an experimental technique that reproducibly shows that a nuclear reaction can
accompany electrolysis, to demonstrate some of the characteristics of the nuclear reaction, and to provide convincing evidence that justifies initiating extensive research
in this new segment of nuclear physics not only because of its intrinsic scientific interest but also because of the possible development of a useful source of energy.
ACKNOWLEDGMENTS
Suggestions from and discussions with J.C. Fisher are gratefully acknowledged.
REFERENCES
1. W.Fleischmann and S. Pons, J. Electroanal. Chem. 261, 301 (1989).
2. E. Storms, Fusion Technol. 20, 433 (1991).
3. R.L. Fleischer, P.B. Price, and R.M. Walker, Nuclear Tracks in Solids, University of California Press, Berkeley, California (1975).
4. R.A. Oriani and J.C. Fisher, Jpn.J.Appl. Phys., Part 1 no.10, 41, 6180 (2002); ibid. Part 1, no.3, 42, 1498 (2003) [erratum].
5. R.A. Oriani and J.C. Fisher, Proc. 10th Intl. Conf. Cold Fusion, 577-584 (2003).
6. Pam Boss, SPAWAR Systems Center, San Diego, California.
7. R.A. Oriani [unpublished research].
8. A.G. Lipson, G.H. Miley, A.S. Roussetski, and E.I Saunin, Proc. 10th Intl. Conf. Cold Fusion, 539-558 (2003).
9. R.A. Oriani and J.C. Fisher, Proc. 10th Intl. Conf. Cold Fusion, 567-575 (2003).
FIGURES
==============================
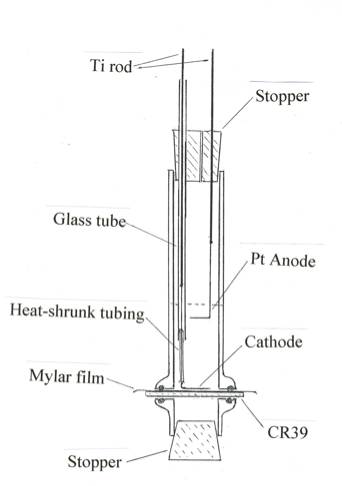
FIG. 1. The glass cell employed for electrolysis. The cathode assembly can be slid up and down gently to contact the Mylar film lying upon the detector chip.
=========================================================
==============================
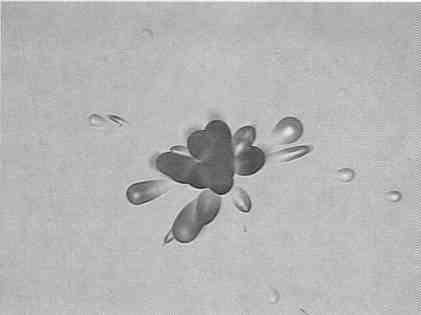
FIG. 2. The nuclear track configuration here called a rosette (original magnification 500X). The major axes of the elliptical and conical pits point to a common origin, and their sense shows that all of the tracks emanate from a common point. A rosette can result from a very small particle of a radioactive substance deposited upon the detector surface.
=========================================================
==============================
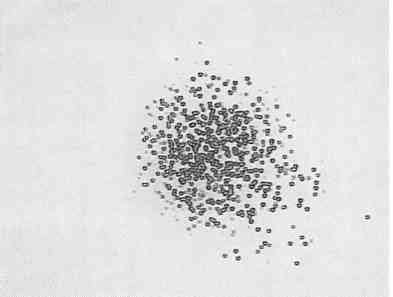
FIG. 3. A typical group of nuclear pits here called a cluster (original magnification 100X). It is a high-density grouping of nuclear tracks without any orientational relation among them, occupying an area of the detector chip otherwise fairly devoid of tracks.
=========================================================
==============================
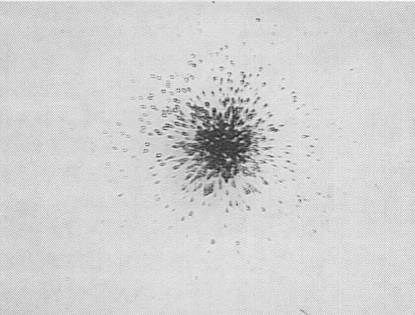
FIG. 4. A radiating cluster (original magnification 100X) typically containing pits of various shapes with the major axes of the non-circular pits radiating out from a common center.
=========================================================
==============================
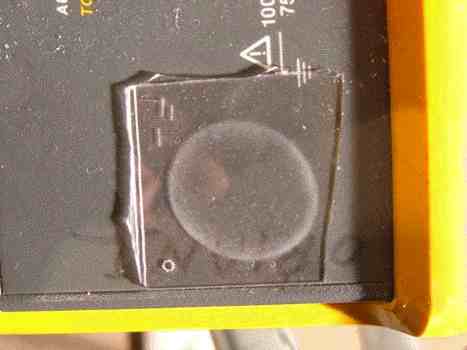
FIG. 5. Photograph of an etched detector chip upon which had been laid an o-ring previously used in an operating electrolysis cell.
=========================================================
==============================
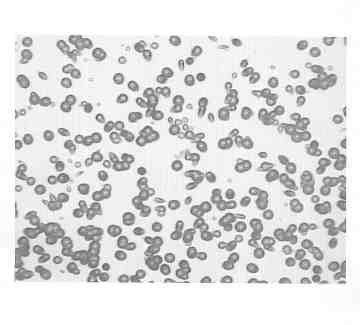
FIG. 6. Photomicrograph (originally 100X) of a portion of the circular haze region of Fig.5.
=========================================================
==============================
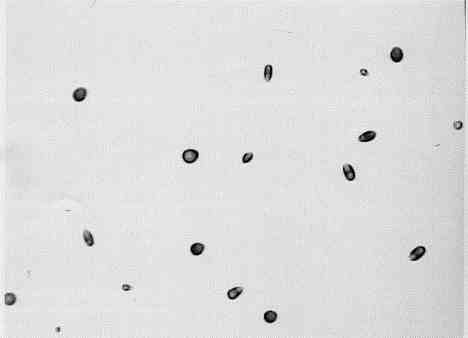
FIG. 7. Photomicrograph (100X original magnification) of 0.008 cm2 of etched detector chip very near the center of the area that had been bounded by the o-ring (see Fig.5) in a post-electrolysis experiment.
=========================================================
==============================
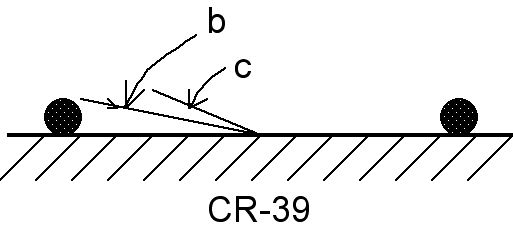
FIG. 8. Schematic diagram of the cross-section of a previously used o-ring resting upon a detector chip. Angle b, about 11 degrees, is the largest possible angle between the detector surface and the path of a nuclear particle going directly from the o-ring to the center of the area enclosed by the o-ring. Angle c is the critical angle (3) of particle impingement smaller than which etching does not produce a pit to mark the damage trail. This angle is about 36 degrees (9).
=========================================================
                                  TABLE I
                 Results of Control Experiments, Tracks/cm^2
- - - - - - - - - - - - - - - - - - - - - - - - - - - - - - - - - - - - - -

Configuration            First CR39 sheet       Second CR39 sheet
                         Average  Std.Dev.      Average  Std.Dev.

Wrapped in Mylar          26.4      12.1        13.6        6.8

With new o-rings                                16.6        9.7

In stock electrolyte solution
                                                 6.5         3.7

Within assembled
unused cell                                     15.4         5.2

- - - - - - - - - - - - - - - - - - - - - - - - - - - - - - - - - - - - - -
                                 TABLE II
Summary of Consecutive Electrolysis Experiments. The first 11 experiments
were done with the detector chips cut from the first CR39 sheet (see Table I),
all of the rest were done with a second sheet.
- - - - - - - - - - - - - - - - - - - - - - - - - - - - - - - - - - - - - -


Experiment  Cell    Current   Duration           Tracks/cm^2
Number                mA       hours         Front         Rear

1 a          S        0.2-25    168           284          150
2 *          S        0.1-45    120           156 C        160
3 b          S        12-100    102           ---          ---
4            S        70-143     67           352           16
5            S         30-95     96           393 C        498 C
6            S            50     97            76           74
7            S          5-50     96.5          71 C         96
8            S        10-100     94            80           70 c
9            S           300     65             d            #
10           B         10,25     98            98           40 e
11           S         12,28     97           229 c         48 e
12           S            20     95            38 e        167 e,163 e
13           B            27     95           193 e        298
14           S            20     94            11           81 c
15           B            19     94           195           49 c
16           S            40     94            36 e          9 c, 103
17           S            39     94           127            9 c, 32 f
18           S            60     93            28          102 c
19           B            60     93            47           35 f
20           S            80    117            72 e         41 c
21           B            80    117            60 e        132 c,f
22           S           100     93           426          207
23           B           101     93            62           51 f
24           S            50     96           102           38 f
25           B            50     96            26          344 f
- - - - - - - - - - - - - - - - - - - - - - - - - - - - - - - - - - - - - -

a The electrolyte in these two experiments was LiCl plus PdCl2 in D2O
  with Ag as cathode material. For all other experiments Li2SO4 in H2O
  with Ni as cathode was employed.
b In experiment 3, the detector chip was lost before a careful count of
  the clearly large number of tracks could be made.
c Some of the tracks appear in clusters.

d The number of tracks was so great that counting was impractical.
e The blue protective film supplied by the manufacturer was kept on the
  detector chip; in exps. 12, 16, and 17, only one-half of the detector
  surface was kept covered by the film.
f D2O was maintained within the closed air space below the detector chip.
- - - - - - - - - - - - - - - - - - - - - - - - - - - - - - - - - - - - - -


                                TABLE III
   Residual nuclear activity. The mean value of the controls for fresh
   o-rings upon detector chips is 16.6 with standard deviation of 9.7.
- - - - - - - - - - - - - - - - - - - - - - - - - - - - - - - - - - - - - -
Experiment   Exposure (days)                   Tracks/cm^2
                                     Front       Rear

     1             3                  a,b        176
     2             3                  a,b       17.4
     3             5                   70        211
     4             4                   30        176
     5             4                    c
     6             3                   16          c
     7             3                   78
     8             3                  a,b          a
     9             3                  362         25c
    10             3                  13.4      13.4c
    11             4                  350
    12             4                  228       20.5
    13             4                  a,b          a


- - - - - - - - - - - - - - - - - - - - - - - - - - - - - - - - - - - - - -

a The number of tracks was so large that counting was impractical.

b The circle of the o-ring was followed by the swarm of nuclear tracks. See Fig. 5.
c A cluster of tracks appeared.
- - - - - - - - - - - - - - - - - - - - - - - - - - - - - - - - - - - - - -


This website contains other cold fusion items.


Click to see the list of links