| International Comparisons of Energy Efficiency |
|
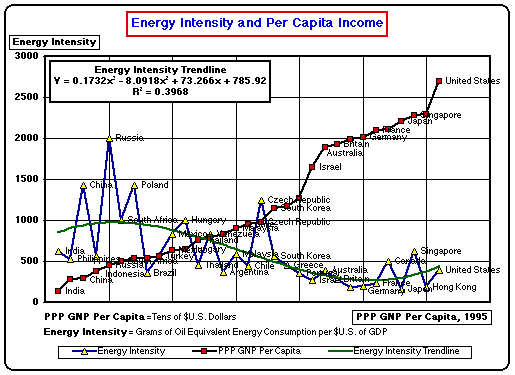
Why do some countries use energy more efficiently than others? How is it possible that when the United States was less dependent on imported energy in 1973 it was affected significantly by a world energy crisis, and that it is more dependent on energy imports today with no apparent signs of an impending energy crisis? Answers to these quesions depend on the underlying price and income elasticities of supply and demand, as well on the role of technology. While today's energy environment may seem relatively calm, the potential for a new energy crisis will depend on what kinds of policies are adopted by the United States and the major energy consuming countries in the world. The first point of comparison is the relationship between energy intensity and per capita income. Energy intensity measures the standardized energy consumption from all forms of energy needed to produce a dollar's worth of output, using a standard measure of output such as GDP, GNP, or National Income. |

|
|
|
|
| India | 1400 | 0.625 |
| Philippines | 2850 | 0.526 |
| China | 2920 | 1.4285 |
| Indonesia | 3800 | 0.5555 |
| Russia | 4480 | 2.0000 |
| South Africa | 5030 | 1.0000 |
| Poland | 5400 | 1.4285 |
| Brazil | 5400 | 0.3571 |
| Turkey | 5580 | 0.5555 |
| Mexico | 6400 | 0.8333 |
| Hungary | 6410 | 1.0000 |
| Thailand | 7540 | 0.4545 |
| Venezuela | 7900 | 0.8333 |
| Argentina | 8310 | 0.3703 |
| Malaysia | 9020 | 0.5882 |
| Chile | 9520 | 0.4347 |
| Czech Republic | 9770 | 1.2500 |
| South Korea | 11450 | 0.5555 |
| Greece | 11710 | 0.4545 |
| Portugal | 12670 | 0.3571 |
| Israel | 16490 | 0.2702 |
| Australia | 18940 | 0.3846 |
| Britain | 19260 | 0.2857 |
| Italy | 19870 | 0.1818 |
| Germany | 20070 | 0.2000 |
| France | 21030 | 0.2272 |
| Canada | 21130 | 0.5000 |
| Japan | 22110 | 0.1612 |
| Singapore | 22770 | 0.6250 |
| Hong Kong | 22950 | 0.1886 |
| United States | 26980 | 0.3846 |
Source: The World Bank: World Development Indicators 1997 (Washington, D.C.: The World Bank, 1997)

| Energy Intensity | Premium Gasoline Price $U.S. | |
| Russia | 20.00 | 0.46 |
| Venezuela | 8.33 | 0.9 |
| Turkey | 5.55 | 0.92 |
| China | 14.28 | 0.93 |
| Indonesia | 5.55 | 0.94 |
| Philippines | 5.26 | 1.38 |
| Mexico | 8.33 | 1.41 |
| United States | 3.84 | 1.42 |
| Thailand | 4.54 | 1.44 |
| Canada | 5.00 | 1.92 |
| Chile | 4.34 | 2.16 |
| Malaysia | 5.88 | 2.2 |
| Australia | 3.84 | 2.2 |
| India | 6.25 | 2.25 |
| Poland | 14.28 | 2.29 |
| Brazil | 3.57 | 2.3 |
| South Africa | 10.00 | 2.57 |
| Czech Republic | 12.51 | 2.85 |
| Greece | 4.54 | 3.06 |
| Argentina | 3.703 | 3.1 |
| Israel | 2.70 | 3.2 |
| Singapore | 6.25 | 3.23 |
| Hungary | 10.00 | 3.26 |
| Japan | 1.61 | 3.28 |
| South Korea | 5.55 | 3.82 |
| Portugal | 3.57 | 3.85 |
| Germany | 2.00 | 3.87 |
| Italy | 1.81 | 4.21 |
| France | 2.27 | 4.22 |
| Britain | 2.86 | 4.25 |
| Hong Kong | 1.89 | 4.9 |
|
Dasgupta, Partha and Geoffrey Heal. Economic Theory and Exhaustible Resources. (Cambridge: Cambridge University Press, 1979). Hotelling, Harold. "The Economics of Exhaustibe Resources," The Journal of Political Economy 39:2 (1931), pp. 137-75. Krautkraemer, Jeffrey, "Nonrenewable Resource Scarcity," Journal of Economic Literature XXXVI:4 (December 1998), pp. 2065-2107. LeBel, Phillip G. Energy Economics and Technology (Baltimore: The Johns Hopkins University Press, 1982). OECD. World Energy Outlook 1998. (Washington, D.C.: OECD, 1998). Smith, V. Kerry, editor. Scarcity and Growth Reconsidered. (Baltimore: The Johns Hopkins University Press, 1979). U.S. Department of Energy. Monthly Energy Review. (Washington, D.C.: U.S. Government Printing Office) |