Return to the clickable list of items
188) Oriani cell effects
Ludwik Kowalski (November 22, 2004)
Department of Mathematical Sciences
Montclair State University, Upper Montclair, NJ, 07043
I just returned from a “field trip” to Oriani’s lab at the University
of Minnesota (UM) in Minneapolis. Who is Richard Oriani? He told me: “my mother
and father were both born in El Salvador as I was. He was of Italian descent, and she
was of Spanish descent.” The family immigrated to the US in 1920s. Richard was
born 84 years ago; he thinks he is the oldest active cold fusion researcher. He is
also a veteran of the field, exploring it since its very beginnings in 1989. Few were
as well prepared for such work as he was. A metallurgist with a Ph.D. in physical
chemistry from Princeton, he was, for many years, a director of a large anticorrosion
institute at the UM. I met him for the first time at the 2003 cold fusion conference
(ICCF10). He and Fisher presented two papers describing the use of CR-39 detectors to
detect showers of nuclear particles in the liquid and above the liquid of a running
electrolytic cell. That inspired me to start using such detectors. We corresponded
by e-mail (see unit #108 at this website) and at one point -- it was several months
ago -- I asked if he could help me design a simple and convincing cold fusion experiment
for teachers and students. He agreed and last week’s trip was the result of that
invitation. I wanted to see the experiment with my own eyes.
Oriani has several electrolytic cells. I will describe just one of them. He calls it
a “vertical cell;” I will refer to it as an “Oriani vertical cell.” It
is essentially a glass tube whose bottom (cathode) consists of a metallic foil, for example
nickel of 0.125 mm. The tube is half-filled with a solution of Li2SO4
in ordinary water. The anode, made from a platinum wire, is inserted into the solution from
the stopper, at the upper end of the tube. That stopper has an opening; its purpose is to
allow oxygen and hydrogen, produced during the electrolysis of water, to escape into the
atmosphere. The electrodes of the cell are connected to a power supply (about 5 volts) and
a current of 0.2 amperes is allowed to flow. Nothing unusual so far; it is a simple electrolytic
cell producing oxygen and hydrogen from water. Several anomalous effects were discovered with
this device. I will refer to them as: (a) Oriani liquid effect, (b) Oriani vapor effect and
(c) Oriani solid effect. I was privileged to perform experiments demonstrating each of these
effects. Papers (1,2) describing the (a) and (b) effects have been available on the Internet
for more than one year. The (c) effect was described in a paper presented at the last cold
fusion conference in Marseilles (3).
In what follows I focus on the Oriani solid effect. It consists of demonstrating emission of
charged nuclear particles from the nickel cathode during and after the electrolysis. The
particles were recorded in a detector placed in air, 1.5 cm below the nickel foil. I have no
doubt that some kind of nuclear activity is triggered in the Oriani cell during the
electrolysis.
In my opinion, Oriani effects should not be labeled “cold fusion”, as defined
in 1989 (4); neither palladium nor heavy water are used in the setup. What happens in the
cell cannot be a fusion of two deuterium nuclei. This would be highly improbable due to
repulsion of positive nuclei and due to the quasi-absence of deuterium in ordinary water.
If it were up to me I would replace the term “cold fusion” by the term “anomalous
nuclear activity” and would invent separate names for different effects, such as: generation
of neutrons, excess heat, production of tritium, accumulation of helium, transmutation of
isotopes, etc., etc. But, being realistic, I know that the term “cold fusion” will
be used (inappropriately) as an umbrella for a large number of effects (that may or may not
be related). That is how I am going to use this term.
The figure below is a simplified drawing of the Oriani cell. I plan to use such cell in my
own experiment at home. Note that the nickel foil is squeezed between the two rubber O-rings
(dark circles). The two vertical tubes (inner diameter 1.5 cm), into which the O-rings are
inserted, are called “flanged joints.” The two aluminum plates that press the joints
toward each other (with screws) are not shown. The upper tube is partially filled with the
electrolyte into which a platinum wire is inserted. The lower part of the wire, a pancake-like
spiral (diameter of about 1.3 cm), is used as an anode.
Chemicals needed (NaOH and Li2SO4), are likely to be available in a
typical school laboratory. Chemicals can also be purchased, for example from Aldrich Chemical
Company, Inc. The estimated cost of major components is:
Two flanged joints, $20
Six pure nickel foils, 0.125 mm, 15 by 15 cm each (enough for 30 cells) $150
Lithium sulfate, 99% pure, 100 grams (enough for hundreds of experiments), $21
Sodium hydroxide, 1 kg, (enought for hundreds of experiments), $26
Platinum wire (0.25 mm diameter and 25 cm long), $30
All these components can be purchased, for example, from Aldrich. The most expensive
components, the power supply and an optical microscope, are likely to be available in a typical
school laboratory. The microscope magnifications of 40 and 200 are sutable. The clamps holding
the joints togrther can be quite expensive, for example, $150, if custom-made in a commercial
machine shop. But a pair of large washers, with three matching holes along perimeters, can also
be used to push the joints toward each other with a set of three screws. The inner openings of
washers should be slightly larger than outer diameters of tubes. A set of two brass wall flanges,
from Lido Rail Systems (costing $6.50 in Home Depo), is an ideal clamp for tubes whose outer
diameters are between 0.8 and 1.0 inches. This is only an example; any set of rigid curtain rod
holders, with holes, would be suitable, provided it matches the tube diameters.
The actual vertical cell used by Oriani is only slightly more complicated than that shown in
Figure 1; it has wires to suspend additional detectors, some to be kept in the liquid and
others to be kept above the liquid. These additional detectors are used to study the (a)
and (b) effects. I plan to replicate only the (c) effect. An experiment for teachers and
students should be as simple as possible.
Figure 1
Let me now describe one of the experiments performed in Oriani’s lab. We inserted a
new nickel plate and prepared fresh electrolyte (2.36 grams of Li2SO4
per 100 cc of the ordinary water). The surface of the nickel, to face the electrolyte, was
scratched with a sharp knife. Oriani said “this can not hurt, it might help.” Then
the cell was assembled, the electrolyte was introduced into it (with a pipette) and the
current was turned on for 72 hours. During the first 24 hours the current was 0.20 A,
during the next 24 hours it was 0.27 A, and during the last 24 hours it was 0.33. Oriani
said: “I do not know which current is the best so I use several different currents.”
A large number of tracks of nuclear particles was recorded by the detector situated in air
below the cathode. The distance between the detector and the cathode was 1.5 cm.
After three days the electrolyte was removed and the cell was dismounted. The nickel cathode
was at once sandwiched between two CR-39 detectors (see the appendix below) for 26.5 hours.
Once again, a large number of nuclear particle tracks was recorded. Figure 2 is a typical
photo of tracks seen unser the microscope. The surface area shown in Figure 2 is very small;
most of the areas of that size, for control chip measuring the background, display zero or
one tracks. Encountering three tracks on such small area is very rare. A typical background
for our detectors is 10 tracks per square centimeter (fluctating between 0 and 30).
72 hours of exposure during the electrolysis
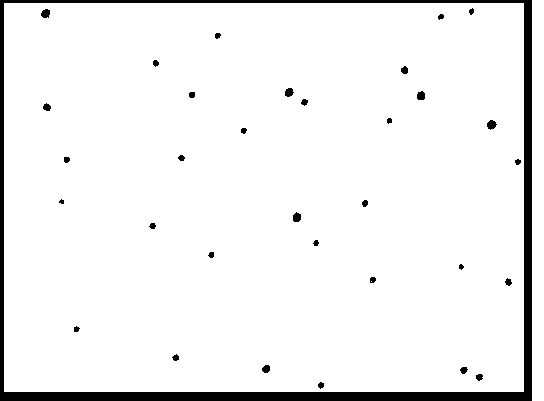
Figure 2
The area of the detector used during the electrolysis was about 0.6 cm2. The
number of tracks recorded on it was found to be 1816. This translates into the track
density of 3026 per square centimeter and to the recording rate of 42 counts per hour
per square centimeter. That is about 300 times higher than our typical background. In
other words, what is shown in Figure 2 is certainly not the residual tracks due to radon
and cosmic rays. Was the rate of emission constant during the electrolysis? An experiment
in which the CR-39 detector is going to be replaced by an electronic (surface barrier)
detector is in preparation. After that experiment Oriani should know the answer to this
question. He will also measure the energy spectrum of unexpected particles emitted by
nickel during the electrolysis.
Tracks recorded after the end of electrolysis.
The cathode was removed from the cell and immediately sandwiched between two fresh CR-39
detectors for 26.5 hours. After that the detectors were etched and tracks were counted on
all four surfaces. Each surface had an area of 1.2 cm2. The results are shwn
below. The terms “front” and “rear” are used by Oriani to identify two
surfaces of a single chip. Front is the side facing the cathode and rear is the opposite
side. The cathode also has two distinct surfaces, one called “wet” (because
during the electrolysis it was in contact with the electrolyte) and another called
“dry” (because during the electrolysis it was in contact with the outside air).
The detector facing the “wet” cathode recorded 951 tracks in “front,”
and 122 in “rear.” These numbers are significantely different than what was
detected on the “dry” side of the cathode. The detector placed on that side
recorded 132 tracks in “front” and 7 in “rear.” Note that 951 tracks
translates into 30 tracks per hour per square centimeter.
The second test for the emission of particles (with a fresh pair of CR-39 chips) started
27 hours after the end of electrolysis and lasted 70 hours. During this test the detector
facing the “wet” cathode recorded 1529 tracks in “front” and 373
in “rear.” These numbers are significantely different from what was detected on
the “dry” side of the cathode. The detector placed on that side recorded 80 tracks
in “front” and 22 in “rear.” Note that 1529 tracks translates into 18
tracks per hour per square centimeter. Keep in mind that the geometry of counting
during the electrolysis (detector 1.5 cm below the nickel cathode) was very different from
the geometry of counting after the electrolysis (when each detector was in contact with
the nickel foil).
Considering a possibility that our nickel foils (nominally 99.99% pure before the electrolysis)
might contain traces of naturally radioactive materials, such as uranium or thorium, we performed
an additional experiment. A fresh piece of nickel, cut from the same large piece as the cathode,
was sandwiched between a pair of CR-39 detectors, also for 26.5 hours. After that exposure the
detectors were etched and examined. All four surfaces had nothing but the background. This
rules out a possibility that particles, detected during the electrolysis, or after the
electrolysis, were due to a contamination.
Was the emission of anomalous nuclear particles after the electrolysis uniform during the
26.5 hours of exposure or were most of the particles emitted quickly after the current was
turned off? Additional data are needed to answer this question. I will append more information,
about our investigations of the Oriani solid effect, as more data become available. Information
from the electronic detector is likely to shed much more light on the nature of the unexpected
nuclear effect triggered by chemical processes in the cell. For the time being we think that
tracks recorded by CR-39 detectors are due to alpha particles and protons. This would be
consistent with two distinct groups of track diameters, large and small. Protons and alpha
particles have already been observed, in very different cold fusion experiments, by other
investigators (5,6). My personal expectation, based also on the experiment described in
unit #184, is that some kind of radioactivity, with a long half-life, is somehow induced in
nickel. But the only things we know for sure, so far, is that: (a) charged nuclear particles
were detected in the air below the nickel cathode during the electrolysis, and, (b) the
cathode was emitting such particles after the current is turned off. I will stay away from
trying to explain these strange phenomena.
Let me end this unit by inviting other people to replicate our observations. According to Oriani,
about 60% of attempts to observe the effect (seeing track densities high above the background)
were successful. This is based on about thirty attempts. My personal experience, in Richard’s
lab, was two undeniable successes in two attempts. Some people say that an experiment should be
100% reproducible before it can be taken seriously. I disagree; even 10% is sufficient, provided
a qualified person, such as Jones, Fleischmann or Oriani, is reporting something new and
unexpected. To be taken seriously does not mean to be accepted as real; it means to study a
phenomenon intensively until it becomes 100% reproducible, at least approximately. A qualified
researcher should never be denied access to a scientific journal without an honest peer
review process , Ridiculing scientists whose reports can not always be confirmed does not
promote our understanding of nature.
The task of those of us who will start studying the Oriani effects would be to identify a
factor (or factors) responsible for the lack of total reproducibility. Is it humidity? Is
it pressure? Is it time of the day? Is it the number of solar flares? Is it the noise level?
Is it proximity of a magnet? Is it the day of the week? Is it wishful thinking? Is it dust?
Is it experimenter bias? If the effect is real, and if a large number of people are studying
it, then, sooner or later, the experimental conditions needed for the 100% reproducibility will
be identified. It is so unfortunate that Oriani’s attempts to publish a paper describing
similar results was recently rejected by several physics journals. How can science develop
if qualified researchers are not allowed to make their findings known? I hope that such
abnormal discrimination (of a field of research) will soon be condemned by those responsible
for scientific research. When will the DOE appointed investigators publish their report?
P.S.(11/23/04)
Oriani wrote to me today that the vapor effect (b) seems to be more reproducible than the
solid effect (c), described in this unit. Should I write a separate unit devoted to the vapor
effect? I might, when time becomes available. For the time being I want to stop writing,
and start working. I hope to observed the mysterious nuclear particles, below the Oriani
cell, in my laboratory.
P.S.(11/24/04)
Oriani also discovered tracks of nuclear particles on detectors placed in air ouside the glass
tube, during the electrolysis. Referring to these recent findings he wrote to me: “I have
found greater reproducibility with chips in the vapor than with chips stuck to the outside
surface of the glass of the cell.” Then he suggested that I focus on the vapor effect
rather on the solid effect. I resisted; in the reply I wrote: “Since you are not
categorically against focusing on the solid effect I will focus on it, as originally
intended. The advantages are: simplicity (no need for the spot-welded hooks, no need for
the ‘roof plate’ above the liquid, no need for the anicondensational heating of
the vapor) and a possibility of replacing the CR-39 chip with an electronic detector. I do
plan on using the electronic detector, after confirming your experiment once again at my
own place. Your vapor effect deserves its own unit and I will try to compose it later.”
The photo of Richard Oriani, taken by me, is shown below.
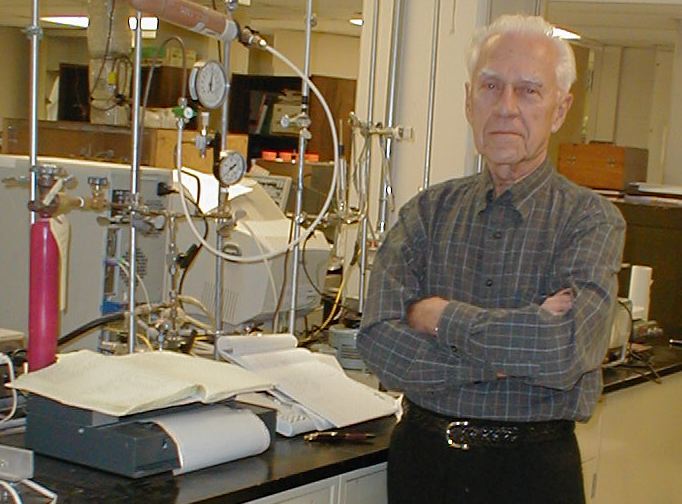
Figure 3
The next picture shows Oriani vertical cell during our experiment. Note the hexagonal plates
squeezing the two O rings toward each other; these plates were not shown in Figure 1. The
electrolyte in the upper tube (white) is full of escaping bubbles. The space above the
electrolyte is heated from the power supply on the left. This prevents condensation of
vapors on CR-39 pieces used to study the Oriani vapor effect. The power supply on the right
is used to control the current flowing through the cell.
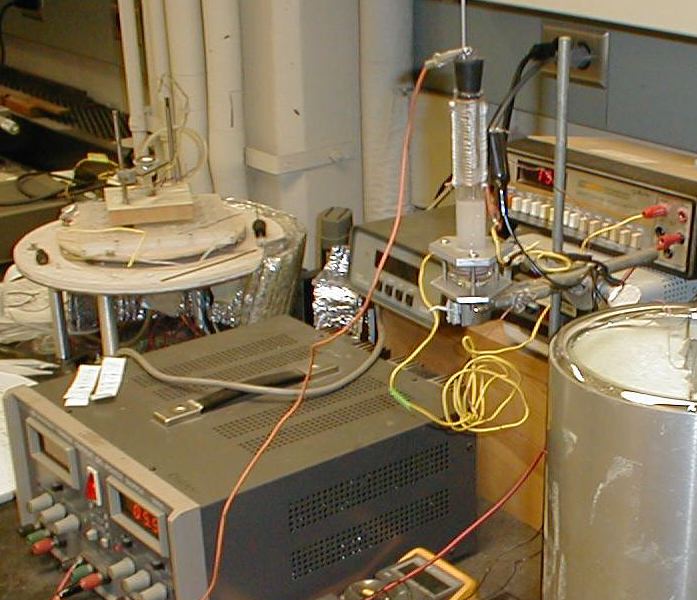
Figure 4
The last picture below was taken at the recent cold fusion conference (November 2004) in
France. It shows two theoretically inclined cold fusion scientists (T. Chubb on the left, and
J. Fisher) discussing something. Their attempts to make sense out of cold fusion phenomena are
very different. They are not alone; I know names of several other scientists advancing their
own theoretical interpretations. Note that most cold fusion researchers are old. Young people
are usually told to stay away from that field of research. What a shame! They should be actively
involved in trying to either validate or invalidate experimental data and emerging theories.
In my opinion cold fusion is an ideal ground for practicing scientific methodologies because
experiments are relatively simple and relatively inexpensive. Who is responsible for the unhealthy
social environement surrounding cold fusion? Those who still think that all cold fusion phenomena
are pseudoscientific. Will the situation be corrected after the report of the DOE appointed panel
is published? I hope so.
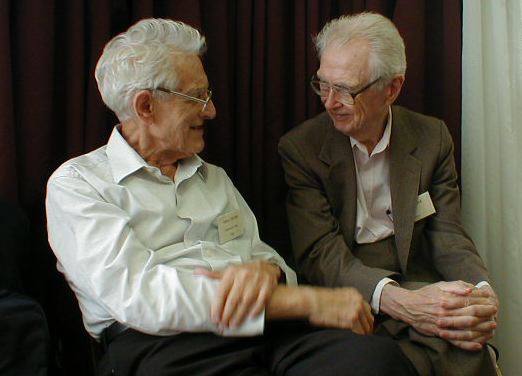
Figure 5
P.S.(11/25/04)
A friend who read this unit asked about the energy balance. My answer was that “no
measurable amount of excess heat would be expected on the basis of the number of observed
tracks, even if each track was associated with 2000 MeV of heat. This number is eleven times
larger that the energy from a single fission of uranium nucleus. The way to demonstrate this
is simple. Assuming the average voltage and current are 6 V and 0.3 A, respectively, the
input power is 6*0.3=1.8 W. The power associated with the 1816 tracks, recorded in 72 hours,
would be (under the above assumption) 2000 MeV * 1816 /72 = 50440 MeV/hour. This translates
into 3.11*10-14 W. Assuming that tracks detected by the CR-39 located 1.5 cm below
the cathode represent only 5 % of tracks emitted in all directions the output power becomes
6.2*10-13 W. This is nearly nothing in comparison with the input power of 1.8 W..
In other words, the number of reaction products is too small to produce a measurable amount
of excess heat during the electrolysis. This is consistent with earlier observations of
other researchers (5,6). The assumption of 2000 MeV of energy per track was deliberately
exaggerated in favor of excess heat. The real energy per track is likely to of the order
of several MeV.
P.S.(11/25/04)
Would a person who is convince that "cold fusion is nonsense" read my paper? I do not think
so. Like many others, including people I know personally, s/he probably thinks that it is
a waste of time to read research reports in the area of cold fusion. But suppose s/he was
forced to come to our conference. Would s/he use earplugs to avoid listening to what Oriani,
or other active scientists, had to say about recent findings? Probably not. And would s/he
accept an invitation to assist in a real experiment, like the one I am going to perform next week?
That would be an indication that s/he is ready to change previousely held vews in face of new
evidence. Why is such step so difficult to many people?
Appendix: The CR-39 detectors
. . . . . .
Most scientists are aware of the role played by track detectors in nuclear physics. A large
number of discoveries were made by using first track detectors: cloud chambers and nuclear
emulsions. CR-39 detectors, like nuclear emulsions, can be developed to show tracks made by
protons and alpha particles. They are made from the same matrial (labeled CR-39) as plastic
eye glasses. The process of development consists of etching the exposed material in a hot
solution of NaOH (6.5 N at 65 degrees C) for several hours. Our method of detection of the
unexpected particles is essentially the same as that used to detect alpha particles from radon,
for example in air or water. Fortunally, the CR-39 material is commercially available (7) in
the form of flat sheets or chips, typically ~1 mm thick. An alpha particle, for example from
radon in a basement, intercepted by a CR-39 chip, creates a tiny track of damaged chemical
bonds that can be made visible by etching (7). Tracks can then be observed by using a common
microscope (8). An extensive review of track detectors has been published recently (9)
References
1) R.A. Oriani and J.C. Fisher, “Detection of energetic charged particles during electrolysis.” This paper was presented at the 10th International Conference on Cold Fusion, August 2003. It can be downloaded from the library at <www.lenr-canr.org>.
2) R.A. Oriani and J.C. Fisher, “Nuclear Reactions produced in an operating electrolysis cell;” This paper will to be published in the proceedings of the 11th International Conference on Cold Fusion, November 2004.
3) R.A. Oriani and J.C. Fisher, “Energetic particle showers in the vapour from electrolysis.” This paper will to be published in the proceedings of the 11th International Conference on Cold Fusion, November 2004.
4) M. Fleischmann and S. Pons, “Electrochemically induced nuclear fusion of deuterium,” J. Electroanal. Chem.,261, 301, 1989.
5) S. E. Jones, F. W. Keeney, A. C. Johnson, D. B. Buehler, F. E. Cecil3, G. Hubler, P. L. Hagelstein, J. E. Ellsworth and M. R. Scott, “ Charged-particle Emissions from Metal Deuterides.” This paper, presented at the Tenth International Conference on Cold Fusion, can be downloaded from the library at <www.lenr-canr.org>.
6) A. Lipson, A.S. Roussetski, G.H. Miley and C.H. Castano; “In-Situ Charged Particles And X-Ray Detection In Pd Thin Film-Cathodes During Electrolysis In Li2SO4/H2O.” This paper, published in the proceedings of of the Ninth International Conference on Cold Fusion, can be downloaded from the library at <www.lenr-canr.org>.
7) A list of suppliers is shown in my unit #185, at <http://blake.montclair.edu/cf/>
8) Fleischer R.L. Price, P.B. and Walker R.M., 1965, "Solid State Track Detectors : Applications to Nuclear Science and Geophysics," University of California Press, 1975.
9) D. Nikezic and K.N. Yub. “Formation and growth of tracks in nuclear track materials.” Materials Science and Engineering,” R 46 (2004) 51–123. That paper is available over the Internet at: <http://www.sciencedirect.com>.
Return to the clickable list of items