Click to see the list of links
258) Sampling errors are not likely to occur
Ludwik Kowalski (9/20/05)
Department of Mathematical Sciences
Montclair State University, Upper Montclair, NJ, 07043
An interesting discussion developed between people planning to replicate the experiment described in unit #252. The voltage applied to the cell, v(t),
will be essentially constant but the current, i(t), will be highly irregular. They are interested in measuring electric energy delivered to the cell
during a test of a known duration. Consecutive values of i(t) will be determined by an instrument performing digital sampling. That energy will be
calculated as a sum of consecutive dE = i(t)*v(t)*dt, where dt is the time interval between samplings. The frequency distribution of i(t) is likely
to be very wide. Suppose that the sampling frequency is much lower than some frequencies contributing to the shape of the waveform. Can this lead to
a systematic error in an attempt to determine the electric energy delivered to the cell? That question is answered below.
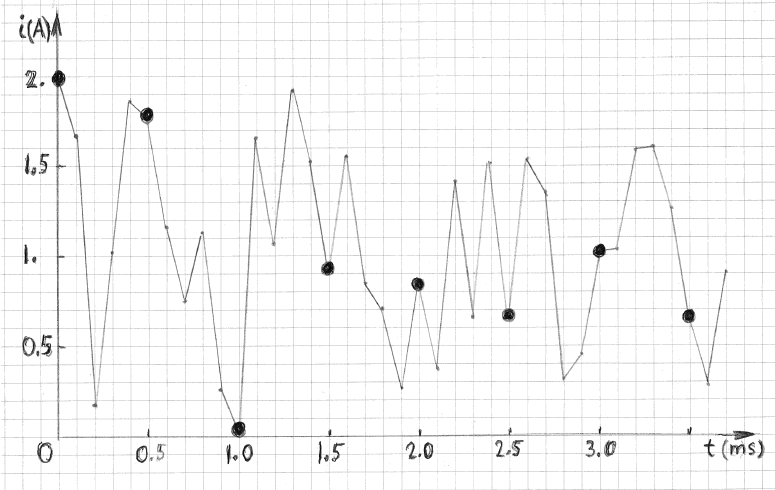
Consider a current waveform shown in Figure 1. It has been generated by using random numbers (from a uniform distribution between 0 and 2). The time
intervals between consecutive current changes were 0.1 ms, as indicated. It is clear that the spectral composition of that waveform contains frequencies
higher than 10 kHz. The mean current, over a long period of time, is 1 A, by design.

FIGURE 1
Suppose that the shape of this waveform must be determined by sampling. The rate of sampling would have to be considerably higher than 10 kHz , for
example, at least two or three measurements during every 0.1 ms. The dark circles show the waveform one would obtain if the rate of sampling were only
2 kHz. This is certainly not a correct representation of the real shape of the waveform. But the situation becomes dramatically different when the
purpose of sampling is to determine the mean current over a long time interval, for example between 0 an 20 seconds. In that case the mean value from
the true waveform and the mean value from the circled waveform would be practically identical. This fact was numerically verified by using a computer
code. The six mean currents, obtained by executing the code six times were: 1.000, 0.999, 0.993, 1.001, 0.992 and 1.004 A.
In other words, the sampling frequency necessary to determine the mean current can be much lower than what would be necessary to determine the shape
of the signal. The only requirement, to obtain a reliable mean value, is to gather a sufficiently large number of samples during the experiment. This
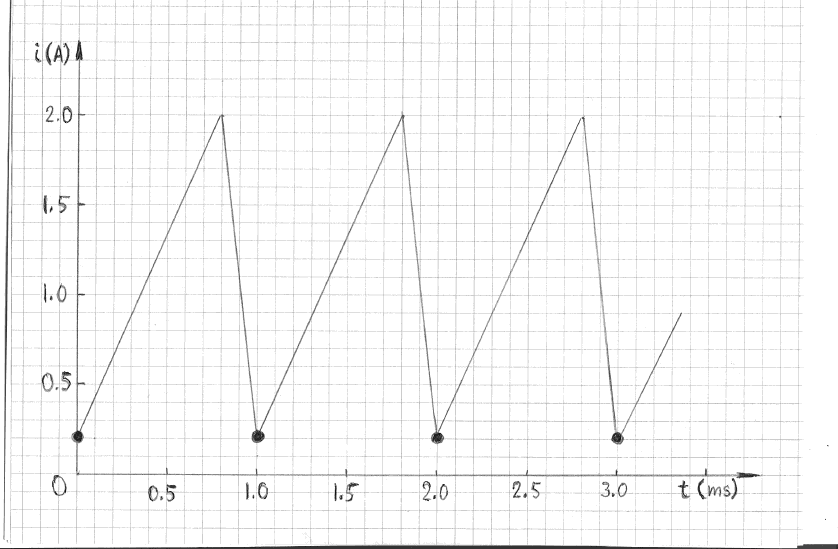
conclusion is intuitively obvious for any random waveform. The situation, however, can be different for a periodic waveform, as illustrated in Figure 2.
In that example the sampling interval -- 1 ms -- is the same as the period of repetition. The apparent mean current would thus be 0.2 A; that is several
times smaller than the true mean current.

FIGURE 2
Note that the apparent mean current of 0.2 A would occur only at sampling frequencies of 1 kHz, 0.5 kHz, 0.25 kHz, 0.125 kHz, etc. At all other sampling
frequencies the apparent and the true means would be nearly identical, provided the sampling interval is negligibly small in comparison with the duration
of the waveform. In other words, an error due to a poor choice of sampling frequency, for a periodic waveform, is possible but not very likely. To
eliminate possible systematic errors periodic waveforms must be sampled at randomly distributed intervals (rather than at equal intervals, as in Figure 2).
using consecutive sampling at two different frequencies, such as 13 kHz and 17 kHz, and showing that the means are nearly identical, would be a good indication
that a sampling error did not occur. Another way to gain confidence would be to connect two ammeters (sampling at different frequencies) in series. Nearly
identical readings would indicate that an error due to sampling did not occur.
Click to see the list of links