Click to see the list of links
267) Searching for excess heat in Mizuno-type
plasma electrolysis
Ludwik Kowalski (a), Scott Little (b), and George Luce (b)
(a) MSU (Montclair State University), Montclair, New Jersey, USA.
(b) ETI (EarthTech International, Inc.), Austin, Texas, USA.
Abstract:
Excess heat generated in the glow discharge plasma electrolysis, first reported by Mizuno and Ohmori (1), has been studied by several researchers,
both in Japan (2, 3, 4) and in other countries (5, 6, 7, 8). Most reports, but not all, confirmed generation of excess heat. Facing this situation
we decided to replicate the most recent experiment (8) in which excess heat was reported to increase with voltage. Our results do not confirm
reality of escess heat. An additional experiment confirming this conclusion will be described in unit #270.
Introduction:
Suppose that a common immersion heater is inserted into a beaker with water. How should thermal energy released in the container depend on the
amount of electric energy supplied? The answer is in the law of conservation energy. The amount of electric energy, E, supplied to the cell
must be equal to the amount of thermal energy released, Q.
E = Q. . . . . . . . . . . . . . (1)
But in the setup described in (8) the right side of the above equation was reported to be significantly larger than the electric energy on the left
side. The authors believe that some hidden energy, presumably nuclear, is released during the plasma electrolysis. That is the essence of the excess
energy claim. Another way of expressing the claim is to say that the coefficient of performance (COP), defined as Q/E, is larger than unity.
According to (8), the COP at 350 V is between 1.31 and 1.41.
In this experiment, where the electrolyte is always boiling, part of the heat energy produced goes into vaporizing water (at the rate of 2260 joules/gram)
and the remainder is lost from the cell through conduction and radiation. To determine the heat output in this experiment we measure the amount of
water evaporated, multiply by the heat of vaporization (i.e. 2260 joules/gm) and then add on a correction to compensate for the nonevaporative loses
of heat. Expressing this in terms of power (i.e. the rate at which energy is delivered and released):
Pout = dm/dt * 2260 + Ploss . . . . . . . (2)
where Pout is the total heat power produced in the cell, dm/dt is the rate at which mass is lost by the cell due to
vaporization, and Ploss is the heat power lost through conduction and radiation.
To determine Ploss, we conducted a series of tests in which the electrolyte was boiled with an ohmic heater at various
power levels. Comparing the actual mass loss to the electrical energy input revealed that, as in (8), the heat loss through conduction, and
radiation is reasonably constant and independent of the electrical input power. That stands to reason because the cell is always operating at
~100C and always has approximately the same level of electrolyte in it. As detailed below we observed a Ploss
value of 94 +/- 10 watts from our cell.
The COP can also be expressed in terms of power as follows:
COP = Pout/Pin. . . . . . . . . . . . .(3)
where Pin is the electrical input power.
Experimental setup
As described in (9), this experiment was prompted by desire to either confirm or refute reality of excess heat as reported in (8). That is why our setup was very similar to that used by Fauvarque et al. Approximately 725 cm3 of the K2CO3 electrolyte (0.2 M) was placed into a polycarbonate vessel whose depth and the inner diameter were 32.0 cm and 11 cm, respectively. The initially anticipated setup, shown in (9), had to be modified to match (8) as closely as possible. Instead of a spiral Pt anode we used a cylinder made from the platinized niobium mesh. The height of that cylinder was 5 cm and its diameter was 6.3 cm. The anode was a 2.38 mm diameter tungsten welding electrode containing 2% of thorium. Both electrodes, and the steam-escape PVC pipe, were mounted on the lid of the main container. The entire setup was supported by a sensitive scale, as shown in Figure 1. "The fresh water reservoir, also mounted on the lid, provided periodic refilling of the vessel. In our case, as described later, the refilling would not proceed as anticipated. A plastic baffle, near the steam exit, was used to shield the pipe from occasional splashes of the electrolyte foam and liquid.
Figure 1
Schematic diagram of our setup. Some condensation is expected to occur on the inner surface of the escape pipe, mostly at the section where the
temperature is the lowest. Drops of condensed water could occasionally be seen dripping into a collector. Temperatures were monitored with two
thermistors, T.
The intensity of splashing during the high voltage electrolysis, had a tendency to increase with the potential difference between the electrodes.
Unless mechanically reduced, such splashing could possibly create an illusion of a voltage-dependent excess heat. The same kind of illusion could
also occur if invisible droplets of foam, mixed with steam, were ejected. Ideally only water vapor (plus some hydrogen and oxygen) should escape
from the boiling liquid. The photographs of the entire setup are shown in Figure 2 and 3. Potasium carbonate, used in common detergents, decreases
the surface tension of water and causes foaming (10). Foaming interfered with constant replacements of evaporated water, used in (8). The head
space in our well-closed cell contained almost nothing but hot water vapor mixed with foam. When bubbles would start up the refill tube so as
to permit water from the reservoir to be displaced into the vessel, the bubbles would rapidly collapse and disappear completely upon entering
the cooler water in the refill tube. However, when we turned off the power to the cell briefly cooler water vapor would successfully enter
the reservoir and allow the refilling to occur. For that reason replacements of evaporated water (typically 30 grams) were preformed manually
before the tests. The electrolyte was then brought to the boiling point by using the ohmic heater. Masses of water evaporated in consecutive
tests were electronically determined (once every second) from the readings of the scale. Flexible conductive filaments were used to connect
electrical components mounted on the lid with outside circuits. This did not interfere with precise measurements of masses (better than 0.5%).
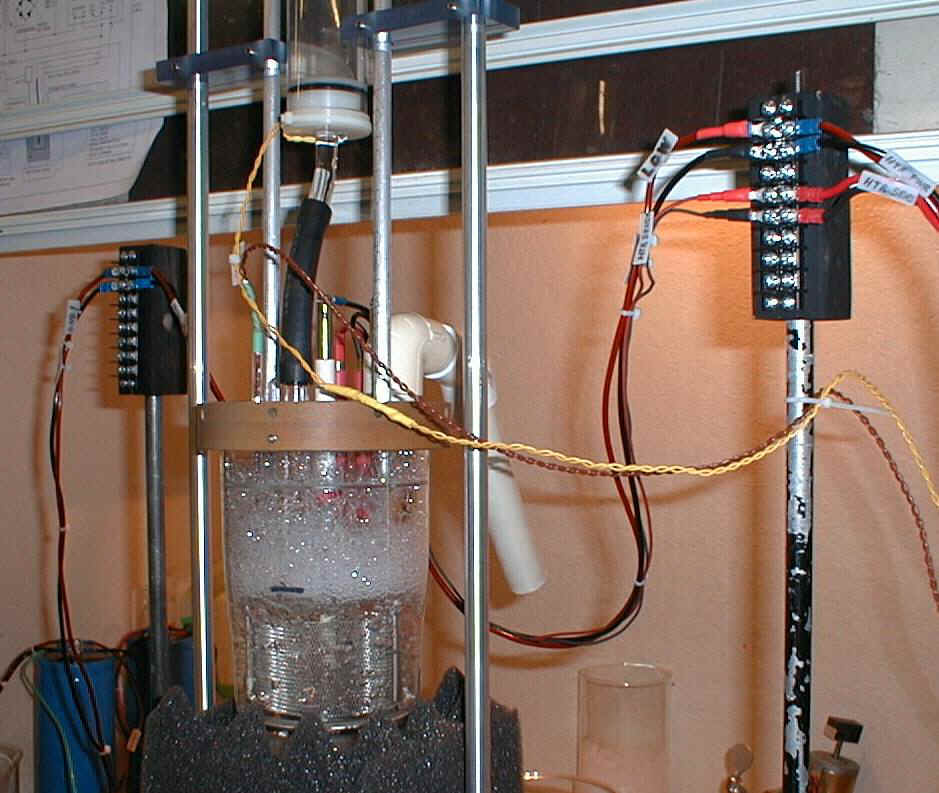
Figure 2
The photo of the setup showing the foam above the electrolyte. The dark cushion below the vessel helped to prevent bouncing of the scale. The inner
diameter of the white PVC pipe was about 22 mm.
= = = = = = = = = = = = = = = = = = = = = = = = = = = = = = = = = = = = =
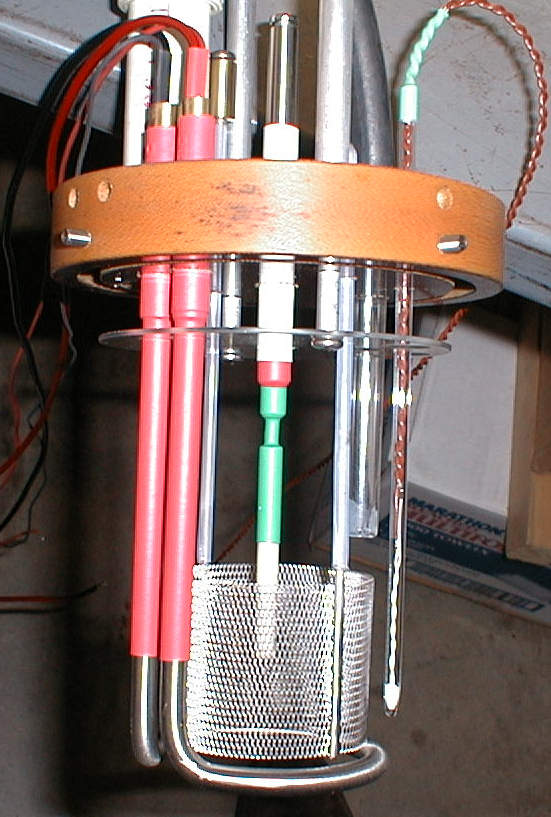
Figure 3
Electrodes and other components mounted on the lid. The ring below the anode is the ohmic heater, the vertical glass tube on the right contains
the thermistor. The transparent antisplashing buffle can be seen below the lid. The side screws were used to mount the lid rigidly on our
polycarbonate cell (note the deep groove on the lower surface of the lid). The tip of the tungsten cathode is shown in Figure 4 below.
= = = = = = = = = = = = = = = = = = = = = = = = = = = = = = = = = = = = =
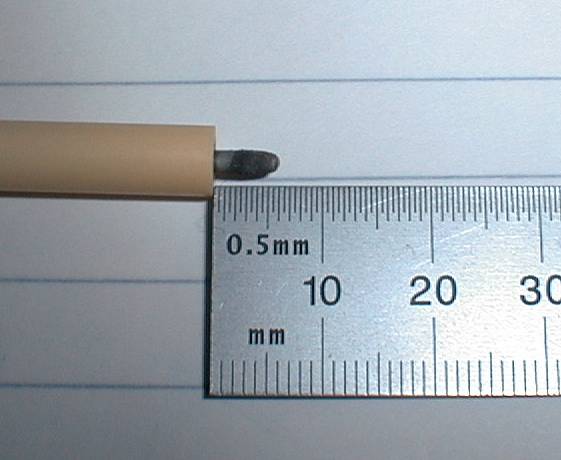
Figure 4
Appearance of the cathode, originally extending 13 mm beyond the ceramic sheath, after a 350 V plasma test (see below) lasting 3 minutes. Typical
current densities were in the range from about 3 to 10 A/cm2.
= = = = = = = = = = = = = = = = = = = = = = = = = = = = = = = = = = = = =
The ohmic heater was used to measure the Ploss, and to preheat the electrolyte before plasma experiments. A
computer-based data acquisition system was recording average electric currents, i(t), average potential differences, v(t), and the remainng
mass m(t) once every second. The Clarke-Hess 2330 Power Analyzer measured power delivered to the cell by simultaneously sampling v and i at
about 2000 Hz, multiplying the pairs of readings together, and averaging the results over several seconds. The data acquisition system
interrogated the Clarke-Hess once per second to obtain the lastest values for rms I, rms V, and power. The electrical setup is shown in
Appendix 1.
Ohmic heater results
The d.c. power supply of our ohmic heater was similar to that used during the plasma electrolysis. Time dependencies of E and m, at constant
electrical power, are shown in Figure 5.
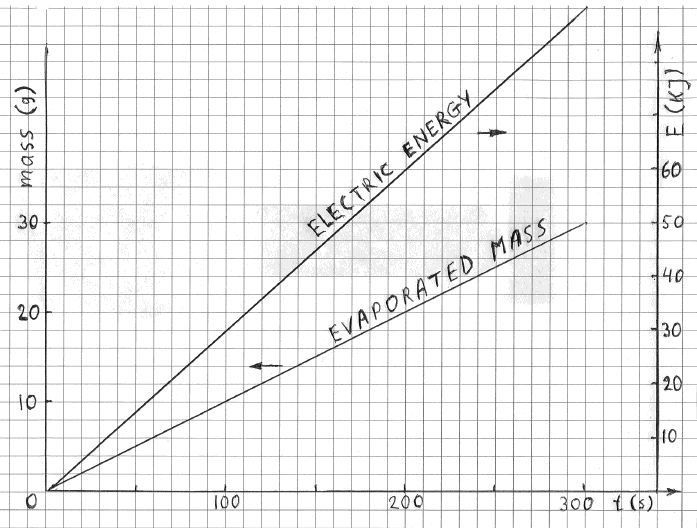
FIGURE 5
Time dependence of the energy received (Pin*t) and of the evaporated mass, m(t), at P=300 W using the ohmic heater.
The rate of evaporation, dm/dt, was also constant, as illustrated. The values of Pin, Pout and Ploss, extracted from this figure are shown in the line 4 of table below.
Table 1 (Ohmic heater results)
  Pin         Pout        Ploss    Pout+Ploss      COP*

  201         107.3        93.7      201.7         1.00
  230         131.9        98.1      226.3         0.98
  262         184.9        77.1      279.3         1.07
  300         208.1        91.9      302.5         1.01
  364         280.2        83.8      374.6         1.03
  479         377.1       101.9      471.5         0.98
  486         380.5       105.5      474.9         0.98
  565         461.6       103.4      556.0         0.98

* The last column shows what the COP's would be
if they were calculated by using the mean value
of Ploss, 94.4 W, instead of numbers from column 3.
That table summarizes results of eight measurements; powers in lines 1 to 3 and 5 to 8 were calculated from the time dependencies similar to those in Figure 5. Note that the third column displays differences between the numbers in column one and two. These are values of nonevaporative powers, Ploss. As in (8), we found that the values of Ploss, are essentially identical for all Pin. This is illustrated in Figure 6. The mean value and standard deviation of Ploss turned out to be 94.4 W and 9.9 W, respectively. The last column shows that the COP fluctuations match experimental uncertainties in the third column. Note that the variations in COP using the ohmic heater are essentially the same as they are with the plasma going (last column in Table 2 below).
Figure 6
Dependence of Ploss (conduction and radiation) on the electric power, Pin.
= = = = = = = = = = = = = = = = = = = = = = = = = = = = = = = = = = = = =
In performing these experiments we discovered that the potassium carbonate electrolyte tends to creates foam above the boiling surface. This is
illustrated in Figure 2. At first we though that the foam was due to chemical interactions between the electrolyte and cell materials (walls, partially
coated electrodes, the lid or the PVC pipe). But foaming was also observed when the electrolyte was boiled in a clean pyrex beaker. Foaming seemed to
be less intense during high voltage electrolysis. Occasional accumulation of the foam resulted in its sudden ejections. Fortunately, a setup in which
all measurements are recorded once a second can identify ejections as sudden mass changes. After discovering nonevaporative ejections we watched the
foam and stopped the runs when foaming became excessive. In that way nonevaporative losses of mass were totally eliminated.
High voltage electrolysis results
Curiously, the foaming seems to be worse during ohmic heating than during plasma operation. It seems that the shocks of the plasma action are
breaking the bubbles faster. Table 2 is the summary of experimental plasma electrolysis results. The most important numbers are in the last column; they are the values of COP
calculated according to the formula (5). The mean COP, and the standard deviation, turned out to be 1.00 and 0.02, respectively. The table shows
that the value of the electric power, P, is not predetermined exactly by the applied voltage. This is probably caused by progressive decomposition
of the cathode and by chemical changes taking place during consecutive tests.
TABLE 2 (Voltages, Powers and values of COP's)
 volts  P(electric)  Pv (evapor)   Pc    Pe + Pc    COP

  250     249.0       155.5       94.4    249.9     1.00
  250     338.0       240.8       94.4    335.2     0.99
  300     626.4       512.6       94.4    607.0     0.97
  300     521.0       424.4       94.4    518.8     1.00
  300     563.0       466.4       94.4    560.8     1.00
  325     718.8       640.3       94.4    734.7     1.02
  350     998.2       934.8       94.4   1029.2     1.03
  350     859.7       748.0       94.4    842.4     0.98
  350*    331.2       246.9       94.4    341.3     1.03
  400*    323.9       243.5       94.4    334.0     1.03
*The last two lines in Table 2 refers to experiments in which the concentration of the electrolyte was reduced drastically (from 0.2M to 0.02M). This reduced the foaming and sloshing inside the cell significantely, most likely due to the unusually low electric electric current (low P). The cathode, however, still achieved a bright incandescent temperature. Thus, even at 400 volts, the COP was still very close to unity. Time dependencies of Pin and Pout associated with two lines of the table are shown in Figure 7. As in Figure 5, one can see that the evaporated mass increases linearly with with time, according to the value of Pin. The values of Pout, during plasma electrolysis, are not as constant, as it was when the 360 W ohmic heater was used. At point B that heater was turned off manually and the potential difference of 300 V was applied to electrodes. The power level jumped to nearly 600 W and the rate of evaporation increased accordingly. The voltage v(t) remained constant but the power drifted slowly toward nearly 500 W. Rapid fluctuations of electric power (plus or minus 5%) were due to fluctuations of electric current, i(t). At point C the voltage was increased to 325 V and the power level jumped to nearly 700 W. The rate of evaporation increased accordingly. The direction of the power drift changed and the intensity of rapid fluctuations increased (to about 12%).
The data collection was stopped manually at point D because of intensive foaming. The trend toward more rapid drift and stronger fluctuations of Pin(t) continued when potential differences were increased to 350 and 400 V. This was associated with intense arc-like explosions inside the vessel. Obtaining reproducible data became more and more difficult above 350 V. Excessive arcing was unpredictable but short time intervals without excessive arcing at higher voltages -- our rare “windows of opportunity” -- were sometimes available to make measurements. No evidence of excess heat at higher voltages (up to 400 V) emerged from these quick explorations.
Figure 7
Time dependence of the electric energy received and of the mass of evapoated water at 300 V (between B and C) and 325 V (between C and D) during
plasma electrolysis. Note that the values of Pin(t), at constant voltages, were not as stable as when the
ohmic heater was used to sustain boiling.
= = = = = = = = = = = = = = = = = = = = = = = = = = = = = = = = = = = = =
Discussion:
Our experiments show no sign of the large excess power reported in (1,2,3,4,5,7, and 8). But they confirm findings reported in (6). It is
remarkable that the COP’s at 200 V and 250 V, reported in (8), are very close to ours. Discrepancies, however, become progressively larger
at higher voltages. Splashing of the electrolyte also becomes more significant at higher voltages. This suggests that unnoticible
loses of the electrolyte, from an open vessel used in (8), might be responsible for differences between the two set of results. Other
discrepancies are worth mentioning. According to (5), the excess energy can be much larger than in (8), even below 200 volts. The COP of the
cold fusion reactor of Naudein (CFR1.1), for example, was reported as 1.85 at 150 volts and about 2.5 A. The electrolyte used in CFR was
exactly the same as in (8). Let us also mention that the COP’s values between 1.2 and 1.4 were recently reported in (7). The corresponding
voltages, however, were not specified. The issue of foaming, most likely associated with formation of CO2 at boiling temperature, (11)
was, unfortunately, not addressed in (5), (7) and (8).
The challenge presented by ejection of liquid water is indeed very serious becase the latent heat of evaporation is large. Mist ejection,
at the rate of 50 milligrams per second, results in the overestimation of Pout by 2260*0.05 = 113 W. This, however, is only one
possible explanation of discrepancies. Another might be associated with microexplosions we occasionally observed during plasma electrolysis,
expecially at higher voltages (see Appendix 3). Such explosions are accompanied by loud popping noise and very intensive arcing. We suspect
that escaping hydrogen and oxygen occasionally combine under the influence of arcing. That could be a possible non-nuclear source of excess
heat repored by several researchers.
Figure 8
Time dependencies of several parameters. Trace A is the ohmic heater power, initially 360 W and then zero. Trace B is the Pin, the electric
power during plasma electrolysis. It was initially zero and then fluctuated near 700 W, more or less as in Figure 8. Trace C, shows the values of
Pout. Unilke other traces on this figure, each data point along the C is the average power from many intant powers (30 seconds on the left
and 30 seconds on the right). That explains why oscillations along the trace C are relatively slow. Note that the boiling temperature was reached
shoerly befotr t = 0. Trace D is the decreasing mass of the cell; it can be used to calculate instant the rate of evaporation. Trace E shows that
the applied voltage, 350 V, remained essentially constant. The unlabeled gray trace is irrelevant, it shows the temperature in the water reservoir
(above the cell lid).
= = = = = = = = = = = = = = = = = = = = = = = = = = = = = = = = = = = = =
Anticipating a possibility of hydrogen burning our tests were manually interrompted as soon as arcing became extensive. Fortunately, prolong arcing
is accompanied by thermal instabilities (large fluctuations in Pout) that can be recognized when data are analyzed after experiments. This is
illustrated in Figure 8. It shows that Pout was stable between t=6s and t=8s. After that it became unstable, due to arcing. Microexplosions
can also be identified by oscilations along the mass trace, D. They are caused by dynamic effects on the scale during microexplosions. In this case data
at t > 8s were ignored.
INSERTED on 11/16/05:
1) A different description of the above experiment has been posted at the EarthTech website:
<http://www.earthtech.org/experiments/Inc-W/Fauvarque>
2) Richard Slaughter, an electrical engineer in Boulder, Colorado, set up an experiment similar to that set up by Scott Little. I participated
in his experiments. This work is described in unit #270 (to be posted in a day or two). The COP values, as you will see, remain very
close to unity, even above those listed in table 2.
APPENDIX 1: Measuring electric energy
Electric energy delivered to a cell, is the integral (over a test duration) of i(t)*v(t)*dt. The instrument we used, Clarke-Hess model 2330 power analyzer, sampled the v(t) and i(t) about 2000 times per second. As expected, the voltage between the cell electrodes, v(t), was essentially constant but the current i(t) was highly irregular. Digitized samples of v(t) and i(t) were recorded by the computer and the cumulative input energy was displayed during the data acquisition, as shown in Figure 7. A highly irregular nature of the i(t) waveform guarantees random sampling and the average energy, over a time longer than several seconds, is highly reliable. To verify this we also used an a.c. watt meter at the input of our d.c. power supply. The a.c. energy measured with that instrument was only slightly larger than the d.c. energy. The difference, was consistent with what is necessary to operate the power supply when it is not loaded. Electrical connections are shown below. The Clarke-Hess meter adjusts the sampling frequency to avoid beats with the current and voltage signals.
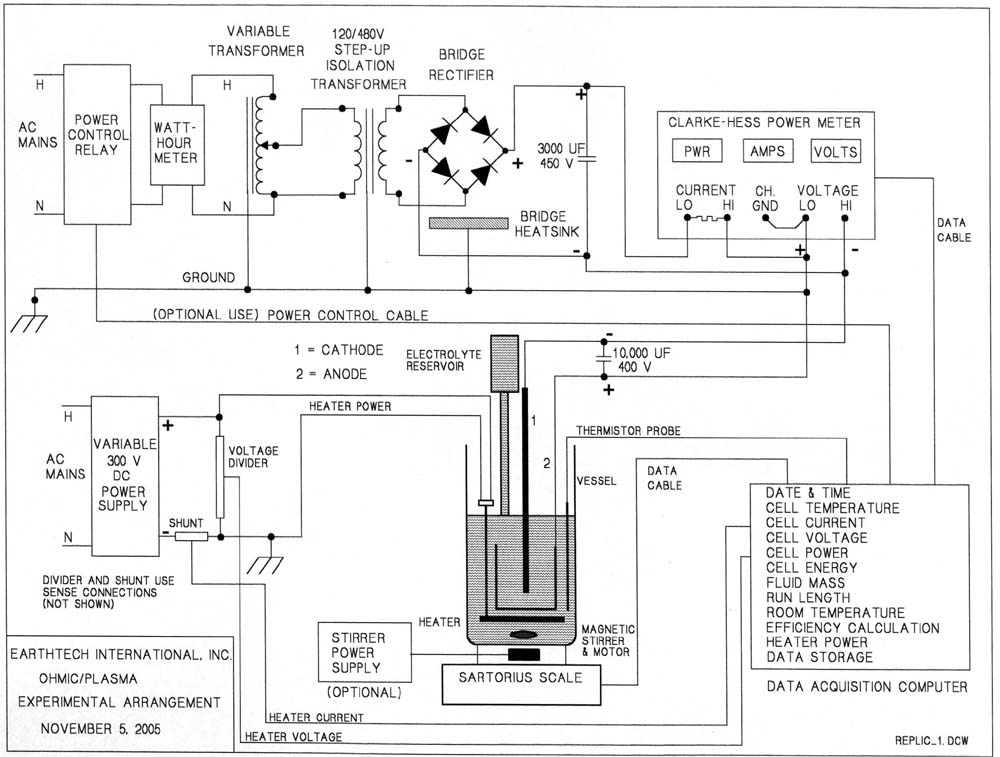
FIGURE 9
Electrical connections.
APPENDIX 2: Discussing Condensation of Steam
Is it possible that condensation of steam inside the cell, for example on the inner walls and on the lid, is responsible for the underestimation of
excess heat? The answer to this question seems to be negative. First, condensation is likely to take place near the outlet of the exhaust pipe where
the temperature is relatively low. Water condensed near the ending of the pipe does not return to the electrolyte. Second, consequences of condensation,
if it were significant, are not as serious as one might think. Heat released in condensation of one gram of
steam is the same as heat used to evaporate one gram of water. Thus each gram of condensed water brings back 2260 Joules of heat. Heating of the
electrolyte by condensation is not distinguishable from heating it electrically. Thus, in the first approximation, condensation has no effect on the
CPU. In reality some heat released in condensation is removed by conduction and convection. But, as in (8), the nonevaporative losses,Ploss
were measured. In other words, the effect of condensation on COP is practically eliminated. Unfortunately, this cannot be said about splashing;
unaccounted splashing might lead to exaggerated values of CPU, and to an illusion that the CPU increases with voltage.
APPENDIX 3: Microexplosions
Using 0.2M K2CO3 electrolyte, our cell consumes nearly 1000 watts at 350 volts. The resulting plasma is so violent that the
electrolyte sloshes all over the place and periodically exposes the cathode. When that happens an arc, possibly accompanied by a H2
+O2 explosion occurs and a small hole is melted in our anode grid. The shock from these explosions is so violent that, even with our
present shock-mounting of the cell, the Sartorius balance is unable to provide stable mass readings, thus ruining our data collection.
Despite these difficulties we have tried running at 350 volts about 6 times now (our Pt-coated Nb mesh anode has about 50 small holes in it now).
On most of these attempts something inside the cell broke apart or the balance was so disturbed by the shocks that its data was meaningless. But
we were lucky enough to catch the cell "behaving" well enough on two of these runs and we got "reasonable measurements" from them.
Another problem is that 1000 watts is out of the power range (0-550 watts) that we can explore with our existing ohmic heater. Thus we are forced
to extrapolate the heat losses and that could be erroneous. On the other hand, if we dilute the electrolyte to 0.02M K2CO3, then the cell consumes
about 300-400 watts at 350 volts and all of the measurement strategies we developed specifically for this experiment work satisfactorily.
To date we have made three "good measurement" runs at 350 volts. The COP's observed on the two runs with 0.2M K2CO3 were
0.98 and 1.03. The COP observed with 0.02M K2CO3 at 350 volts was 1.03. As it turns out none of these COP's is
significantly different than 1.00.
References:
1) Mizuno, T., Ohmori, T., Azumi, K., Akimoto, T., Takahashi, A. “Confirmation of Heat Generation and Anomalous Element Caused by Plasma
Electrolysis in the Liquid. in 8th International Conference on Cold Fusion.” 2000. Lerici (La Spezia), Italy: Italian Physical Society,
Bologna, Italy. Downloadable from the library at <http://www.lenr-canr.org>
2) T. Mizuno, T.Ohmori, T. Akimoto, and A. Takahashi. “Production of Heat During Plasma Electrolysis.” Jpn. J. Appl. Phys. A, 2000.
39: p. 6055. Downloadable from the library at <http://www.lenr-canr.org
3) T. Mizuno, T. Ohmori and T. Akimoto. “Generation of Heat and Products During Plasma Electrolysis,” in Tenth International
Conference on Cold Fusion. 2003. Cambridge, MA. Downloadable from the library at <http://www.lenr-canr.org>
4) T. Mizuno, D. Chang, F. Sesftel and Y. Aoki “Generation of Heat and Products During Plasma Electrolysis,”. in Eleventh
International Conference on Condensed Matter Nuclear Science. 2004. Marseilles, France. Downloadable from the
library at <http://www.lenr-canr.org>
5) Jean-Louis. Naudin et al. Several illustrations and references are downloadable from <http://jlnlabs.imars.com/cfr/index.htm> and
from <http://jlnlabs.imars.com/cfr/html/cfrtpwr.htm>
6) Scott R. Little, H. E. Puthoff and Marissa E. Little, “Search for excess heat from Pt electrolyte discharge in K2CO3-H2O and
K2CO3-D2O electrolysis.” Downloadable from <http://www.earthtech.org/experiments/Inc-W/Mizuno.html>. For replications of
Naudin’s experiments see <http://www.earthtech.org/experiments/IncW/2003/replicationjln.htm>. For replication of Mizuno’s
experiments (Introduction to third series of runs), see <http://www.earthtech.org/experiments/Inc-W/300volt/run1.html>
7) D. Cirillo, A. Dattilo, V. Iorio, “Transmutation of metal to low energy in confined plasma in the water (electrochemical plasma
cell),” ,”. in Eleventh International Conference on Condensed Matter Nuclear Science. 2004. Marcella, France.
Downloadable from the library at <http://www.lenr-canr.org>
8) Jean-Francois Fauvarque, Pierre Paul Clauzon and Gerard Jean Michelle Lalleve. “Abnormal excess heat observed during Mizuno-type
experiments;” 2005. Downloadable from the library at <http://www.lenr-canr.org>
9) Ludwik Kowalski <http://blake.montclair.edu/~kowalskil/cf/252clauzon.html
10) V. Iorio (see reference 7), private communication.
11) X, a chemistry professor at Montclair State University who prefers to remain anonymous. That professor thinks that people studying cold
fusion are wasting time and money. But his was, like other MSU colleagues, a valuable resource on several occasions.
Acknowledgments:
We are grateful to Dr. Hal Puthoff, the director of the EarthTech International, Inc., for supporting this study. Correspondence with Pierre
Clauzon is also highly appreciated. Replication of the setup described in (8) would be much more difficult without his help.
P.S.
1) Clarke-Hess VAW meter (model 2330) is designed to measure power of arbitrary waveform from d.c to 400 kHz. Power is calculated from
sampling volts and amperes about 2000 times per second (16 bit ADCs). Sampling is asynchroneous (to stay away from the fundamental and
harmonics of frequencies present in the waveform. <http://www.clarke-hess.com/2330.html>
2) The data acquisition program controls the run length and measures cell current, voltage, power, mass, temperature, and room
temperature. The program also records the date and time, calculates total cell input energy, and plots all variables to a screen display.
Measurements are written to a disk file unique to each run, which permits later playback and analysis. {And also permits transfer of the
data to a separate spreadsheet program.}
3) Startorius model LC620S digital scale connected to the data acquisition system. Resolution 0.01 grams.
4) Our Pt coated mesh was Nb not Ta and not Ti. It was ordered from Rosenthal Jewelry (don't trust what they have at
<http://www.titancomponents.com/products.htm>, call them at 1-800-327-5784).
Click to see the list of links