Click to see the list of links
275) On rates of nuclear reactions
Ludwik Kowalski; 1/24/2006
Department of Mathematical Sciences
Montclair State University, Upper Montclair, NJ, 07043
Introduction:
This unit can be viewed as a continuation of what I wrote, in unit #144, about very interesting findings of a Japanese physicist, J. Kasagi (1,2).
Recently I visited him, at the Laboratory of Nuclear Science of Tohoku University. This gave us a chance to discuss many topics. One of the topics was
the discrepancy between the theoretically predicted cross sections and cross sections actually measured by Kasagi et al. Here I want to write what I
now know about that discrepancy. Many years ago I wrote an elementary tutorial on nuclear cross sections; it was published in The Physics Teacher (3).
This unit can be viewed as an unpublished appendix for that paper. It shows how to predict rates of D + D collisions at very low energies. The topic
is not new, it is based on the well know tunneling effect, first analyzed theoretically by George Gamow (1928). Some general observations about cold
fusion were added at the end -- between Figure 3 and the photo of Kasagi.
Materials and layers of known thickness:
Suppose that a layer of material of thickness t (cm), and of the molecular weight A (g/mole), has the density rho (g/cm3). In the case of
vanadium, V, for example, A=51 grams per mole and rho=6.1 g/cm3.
a) What is the molecular density n1, of V (how many molecules per cm3)?
n1=rho * N / A . . . (1)
where N=6*1023 is the Avogadro number. Using the above formula we have: n1= 7.2*1022 molecules per cubic centimeter. In this
case each molecule is a single atom.
b) What is the molecular surface density, L, of that V foil if its thickness t=0.01 cm? The term molecular surface density refers to the number of
molecules (atoms) per square centimeters. The answer is:
L=n1 * t=7.2*1022*0.01=7.2*1020 at/cm2 . . . (2)
c) The surface density of a layer, t’, is a quantity expressed in grams per square centimeter. How large is this quantity?
t’ = rho * t=6.1*0.01=0.061 g/cm2 . . . (3)
Beam intensity and flux of projectiles:
A beam of identical projectiles can be characterized by intensity, I, expressed in terms of the number of projectiles per second. A foil, for example,
can be intercepting a beam whose intensity is 109 particles (projectiles) per second. Suppose all particles move as a large uniform cloud
whose velocity is v and whose density n2 (projectiles per cubic centimeter) are known. In that case we can define a quantity called projectiles flux.
The flux, F=n2*v, tells us how many projectiles are intercepted by a perpendicular foil, whose area is one square centimeter, in one second. Thus
F=5*1017 p/(cm2*s) when n2=5*1012 projectiles per cm3 and v=100,000 cm/s.
Rates of nuclear reactions:
The rate of a nuclear reaction, R, is simply a number of reactions taking place per second. R can be as large as 1030 per second or as
small as 10-30 per second. Reactions occur when projectiles traverse targeted material. When the layer of the traversed material is thin
then R is proportional to its molecular surface density, L, and to the beam intensity, I. This can be written as:
R = z*L*I . . . .(4)
where z is a coefficient of proportionality. Note that, according to our definitions of of R, L and I, the unit of z is cm2. For historical
reasons the unit “barn,” abbreviated as b, is also used. By definition, one barn is simply 10-24 cm2. The above formula
shows that R can be calculated when z, L and I are known. Theoretical models are sometimes used to calculate cross sections, as illustrated below. Most
often, however, the values of z are calculated with the above formula after the values of R, L and I have been measured.
Here is a typical illustration for the usefulness of z, no matter how it was actually determined. Suppose that a vanadium foil, whose thickness 0.01 cm,
is bombarded with a beam whose intensity is 109 projectiles per second. How many reactions occur in one hour? Assume that z=0.01 b
(10-26 cm2)? According to the above formula, R = 10-26 *7.2*1020*109 = 7200 per second. The
number of reactions occurring in one hour is 3600 times larger. Formula 4 can be used when the area of a thin foil, often perpendicular to the beam
of projectiles, is sufficiently large to intercept all beam particles.
The rate of reactions can also be calculated when a thin target of area S is immersed into a cloud-like flux of projectiles. In that case the intensity
of the beam crossing the foil, is F*S. Naturally, projectiles that are not intercepted by the foil do not contribute to R. In other words, the number
of reactions per unit time, taking place in a foil, is:
R = z*L*F*S . . . (5)
Replacing F by n2*v, and L by n1*t one has: R = z*n2*v*n1*t*z. Note that t*S is the volume of the targeted area. Projectiles react with bombarded
atomic nuclei inside of that volume. Thus the rate of reactions per unit time, and per unit volume, R’, is given by:
R’ = z*n1*n2*v . . . . (6)
Suppose z = 10-21 cm2, the projectiles density, n1, = 107 (cm-3), the targeted atoms density, n2, =
5*1020 (cm-3), and v = 107 (cm/s). In that case R’= 5*106 (reactions per second and per
cm3).
Fusion cross section of two free deuterons:
Calculations shown above were based on purely geometrical considerations. They apply to all kind of nuclear reactions; each reaction, or a group of
reactions, is associated with its own cross section z. Even two D(d,n), taking place at different kinetic energies of projectiles, E, are usually
characterized by two different value of z. In other words, z is a function of energy. In what follows I will show how that function z(E) can be
determined by using the so-called “tunneling effect formula” of George Gamow (1928). The reaction will be defined as fusion of two deuterons
into what is often called an excited compound nucleus, 4He. The values of z will be shown to decrease more and more rapidly when kinetic
energies becomes lower and lower. The main objection against reality of cold fusion was, and still is, based on the vanishingly small values of z at
very low E. A very small z, according to the formula 5, implies a very small reaction rate. It would be practically impossible to observe fusion
events occurring once per year or once per century.
The cross section of fusion of two deuterons (not interacting with other particles) is given by this formula:
z(E’)=(B / E’) * exp[-G] . . . . (7)
where z is in barns and E’ (the kinetic energy in center of mass) is in keV. For the D+D fusion E’=E / 2, where E is the kinetic energy
of a projectile in the laboratory frame of reference. Both E and E’ are in keV. One keV is 1000 times smaller than one MeV and one MeV is the
same as 1.6*10-13 joules. The theoretically calculated constant G is equal to 31.39*sqr(1/E’), where sqr stands for the square root.
The constant B, equal to 55, was chosen to match the experimentally measured cross sections at those energies at which the values of z are still
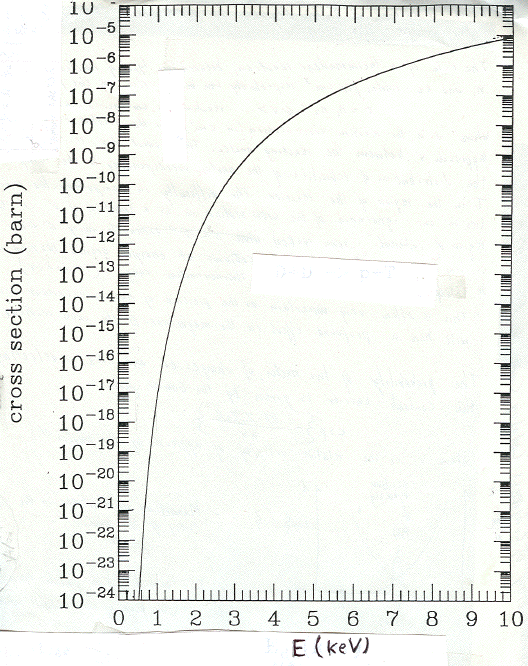
sufficiently large to perform precise measurements. The graph of z versus E is shown in Figure 1. Be aware, while using this graph, that E=2*E’.

Figure 1
Dependence of the fusion cross section on the kinetic energy of projectiles, E.
A numerical illustration:
Suppose that one is interested in the value of z at E=10 keV. That means that E’, to be used in the formula (5) must be 5 keV. The value of z is a
product of two factors:
(B / E’)=55 / 5 =11
and
exp[-31.39*sqr(1/5)] = exp[-31.39*0.447] = exp[-14.04] = 8*10-7
Therefore, z = 11*8*10-7 = 8.8*10-6 barns. The value of z at 1 keV, calculated in the same way, turned out to be close to
10-19 barns. Thus a change in E by one order of magnitude (from 10 keV to 1 keV) resulted in the reduction of the cross section by about
14 orders of magnitude.
Theoretical predictions:
Using the two values of z calculated above, estimate the reaction rates, R’, at E=10 keV and at E=1 keV. Assume that, as before, the
projectiles density, n1, is 107 (cm-3), the targeted atoms density, n2, is 5*1020 (cm-3), and v is
107 (cm/s). The answers, according to formula 6, are: 50,000 fusions per second per cm3 at 10 keV, and less than 2 fusions
per century per cm3 at 1 keV. Reaction rates do become vanishingly small at very low energies.
This did not prevent some scientists to actually measure the values of z at very low energies. Kasagi’s work in that field was described
in the unit #144. He discovered that experimental cross sections are much higher than what was expected theoretically on the basis of formula 7.
Recall that Gamow’s formula refers to fusion of two deuterons, not to reactions, such as D(d,p), in which 3 MeV protons are emitted, or such
as D(d,n), in which 2.4 MeV neutrons are emitted. About 50% of all D+D fusions leads to generation of protons and nearly all the rest leads to
generation of neutrons. Thus the cross sections of each of these two reactions are about one half of what is theoretically calculated according
to the formula 7.
Kasagi found that experimentally measured cross sections, for the 2D(d,p)3T and 2D(d,n)3He reactions,
are in good agreement with predictions based on Gamow’s formula when E are larger than 100 keV. At lower energies, however, differences
between what is predicted and what is measured become progressively larger and larger. This was described in unit #144 at this website. The formula
matching experimental data is
z(E’)=(B /( E’+SE)) * exp[-G’] . . . . (7’)
where G’ must now be equal to 31.39*sqr(1/(E’+SE)). The new parameter, SE, is called “screening energy.” Note that the Formula
7’ includes Formula 7 as a special case with SE=0. The value of SE, as reported recently by Kasagi et al. (1,2), depends on the metallic
environment in which fission of deuterons takes place. The phenomenon is not yet explained by existing theories. One thing, however, is clear, the
effect of the atomic environment on z was assumed to negligible when the theoretical formula 7 was derived. For pure palladium the SE turns out
to be 0.3 keV. For palladium whose surface was oxidized, the value of SE was found to be close to 0.6 keV.

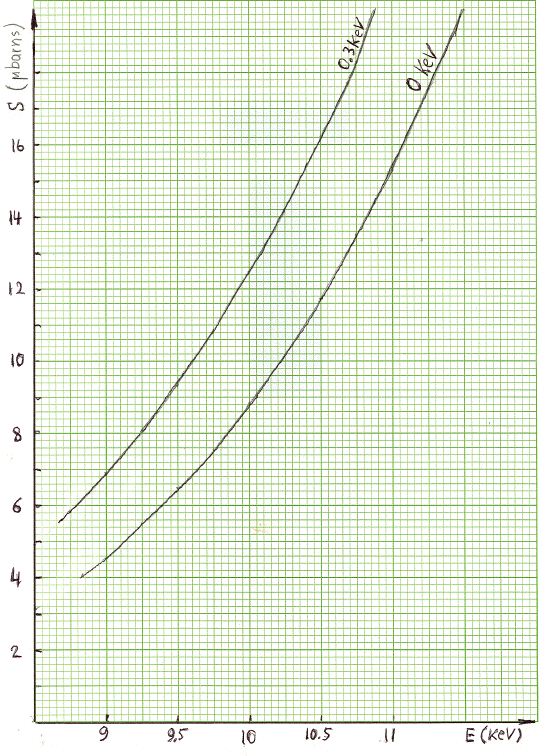
Figure 2 Dependence of the D-D cross section on E near E=10 keV. The numbers above the curves refer to screening energies, SE in keV.

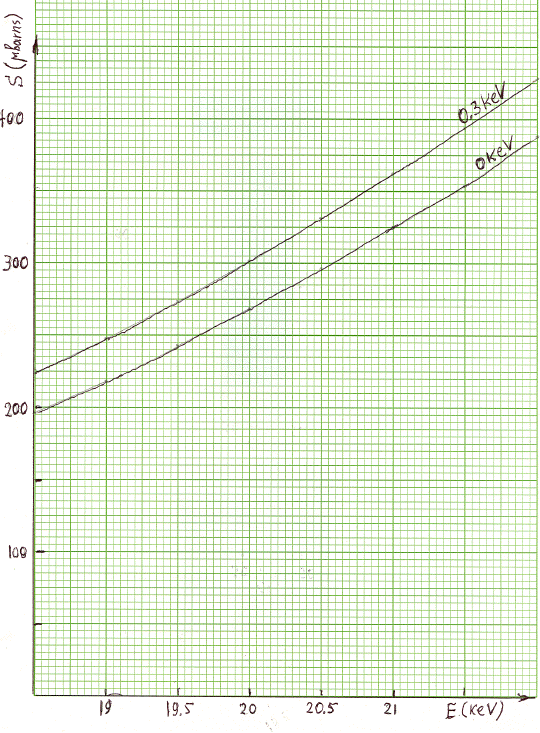
Figure 3 Dependence of the D-D cross section on E near E=20 keV. The numbers above the curves refer to screening energies, SE in keV.
Figures 2 and 3 display the z(E) curves calculated with SE=0 and with SE=0.3 keV Note that, for any given E, the values of z calculated with SE=0.3
keV are above the values calculated with SE=0. The percentage differences between the two z(E) curves decrease rapidly when the energy E becomes
larger. This is numerically illustrated in the table below. The first line shows the energy E in keV while the second line gives the corresponding
“excess z.” That excess is simply the difference between the cross section, z, calculated with SE=0.3 keV and that calculated with SE=0,
divided by z at SE=0.
E (keV) 200 100 20 10 5 3 2Another figure, not shown here, was made for the two z(E) curves in the region of energies between 99 and 101 keV. In that region the curves are even less steep than those in Figure 3. And they are nearly on top of each other. In other words, the differences between the values of z, for any given E, calculated with the two formulas, become less and less significant, as numerically illustrated above.
excess z(%) 0.41 0.77 11.9 20.8 166 678 3549
That observation is important; it helps to understand why Formula 7, which does not account for the effect of screening was, and still is, a very good instrument of prediction at energies above 50 keV. But the same formula becomes less and less reliable at lower energies. Situations like that are common in physics. One that comes to my mind is the description of motion by Galileo and the description of motion by Einstein. Each description is a nearly perfect match for experimental data at speeds below 30,000 km/s. But at higher speeds experimental data are no longer consistent with the Galilean formulas. The formulas derived by Einstein, on the other hand, remain valid.
Unfortunately, the screening effect is not yet understood. But why should this interfere with experimental investigations of unexpected CMNS phenomena at very low energies? Some say that experimental data, at very low E, can not be trusted because they conflict with a theory that was so successful at much higher E. But how can a more inclusive theory be created in the absence of information about reality? This is the well known “chicken and egg” dilemma. Cold fusion implies very low energies, much less than 0.1 keV. Why are some people so certain that a theory nearly perfect at E>100 keV must remain valid at E<1 keV? Yet the first arrogant objection against cold fusion -- I am thinking about Koonin’s phrase “flying pigs” -- was based on Formula 7.
Let me mention, as indicated in (1), that two German teams (Czerski et al. and Raiola et al.) confirmed the fact that experimentally measured fusion cross sections are significantly higher that those predicted with SE=0. The unexpected effect confirmed by three independently working teams is very likely to be real. In any other field this would be more than sufficient for recognition of findings and for triggering support of further investigations. Unfortunately, cold fusion, is not treated in normal way by our scientific establishment, especially by editors of mainstream journals and by funding agencies.
Parametrization of the low energy effect in terms of SE is the first step toward its understanding . Measuring cross sections at very low E is a very difficult task. I worked with Dr. Kasagi for several weeks (on preparation for an upcoming experiment) and I know how competent and careful he is. By the way, Riola, if I recall correctly, referred to SE as “astronomical factor.” Does it mean that screening energies are now used as parameters in astrophysical models? I do not know. But I would be happy to post a short item about this, if somebody sends it to me.

Jirohta Kasagi at the ICCF12 banquet; December, 2005. He likes good beer.
Appendix 1:
In the above examples I always distinguished particles that are bombarded (their density was n1) from the projectiles with which the targeted atoms were
bombarded (Flux, and its density, n2). But such distinction does not exist when reactions take place in hot plasma, or in foils loaded with deuterium by
the way of electrolysis. In such cases one has to deal with random motion of ions which collide with other ions. Each ion can be said to be both the target
and the projectile. How can the rate of reactions be calculated in such situations?
The answer begins with the formula 6. Since n1 and n2 are no longer distinguishable we replace n1 and n2 by n, the atomic density. Thus,
R’=z*n2*v. This formula would be directly applicable if all particles had the same v. In reality one has to deal with a distribution of
v that depends on temperature. In most cases v is much smaller than the speed of light. Thus E=m*v2/2 and v=sqr(2*E/m), where m is the mass of
each deuteron. In the spirit of calculus, for any narrow range of energies (between E and E+dE) the rate of reactions, dR’, is:
dR’=z(E)*n2*sqr(2*E/m)*p(E)*dE . . . . (8)
where p(E) is a well known Maxwell distribution at a given temperature, T. The total reaction rate (per second and per cubic centimeter) is nothing else
but
R’=SUM[dR’] . . . (9)
Summation (actually integration) has to cover all E, from zero to a value at which p(E) becomes practically zero. The integration of the
z(E)*n2*sqr(2*E/m)*p(E) can be performed numerically. The formula for p(E) is:
p(E)=1.128*sqr(E)*(k*T)-1.5*exp(-E/k*T] . . . . (10)
where k is Boltzmann constant and T is the absolute temperature. That function grows when E changes from zero to k*T, After that the values of p(E)
start decreasing monotonically. The product of p(E)*z(E) is an asymmetric bell-shaped curve. The value of E at which the product reaches the maximum
is usually high above the most probable E=k*T. In other words, dR’ are large only for very energetic particles. For not very energetic particles
the p(E) might be large but z(E) is very small. For too energetic particles, on the other hand, the z(E) become large but the p(E) is very small. This
becomes obvious when the p(E) and the S(E) are plotted one above another -- over a wide range of E.
Note that the peak of the p(E)*z(E) shifts toward the higher E, and becomes taller, when the temperature T is increasing. Roughly, the region of T
below 10,000 K belongs to the CMNS phenomena while the region of T above 1,000,000 K belongs to the thermonuclear fusion phenomena. Yes, I know that
such categorization can be criticized; the thermonuclear reactions in the cores of stars do take place in a highly condensed plasma. Note that the
“condensed plasma” term refers to a “high density” medium. The CM in the CMNS acronym, on the other hand, usually refers to
the “crystal-structured” medium. This is ambiguous. “Crystal structured” is “condensed” but “condensed” does
not have to be “crystal structured.”
Appendix 2:
Why did I say that determinations of reaction cross sections, at very low energies, are much more difficult than at higher energies? One
reason has to do with the lower reaction rates. But there are other reasons as well. Let me illustrate the low reaction rates issue first, using a numerical
example. Suppose the the bombarded foil is Pd whose thickness of 0.005 cm. The rho and A , for that material, are 12.0 gr/cm3 and 104.2 gr/mol,
respectively. This gives us n1=6.9*1022 at/cm3. Suppose that the atomic density of our targeted material, deuterium trapped in Pd,
is also n1=6.9*1022 at/cm3. Then L=n1*t=3.45*1020 at/cm2. If E=2 keV and SE=0.3 keV then, according to
Formula 7’, z=4.7*10-35 cm2. What is the reaction rate if I=6.25*1012 ions per second? According to Formula 4,
R=0.1 fusion events per second. This amounts to 360 fusion events per hour. The rate at which protons are emitted is one half of this number.
Assuming that 5% of all protons are intercepted by a detector the expected mean counting rate is 9 per hour.
That number is probably exaggerated by as much as one order of magnitude because the effective t is probably much smaller that 0.005 microns. It must
be equal to the range of 2 keV ions in deuterized palladium. I do not know what the range is; it is probably several times smaller than than 0.005 cm
chosen in the above illustration. A more realistic expectation is probably close to one count per hour. It is not easy to reduce the background to such
level. Note that at E=1 keV z becomes 1200 times smaller.
What can be done to increase R? The detection efficiency can be increased by a factor of three or so. But his is not a big change. The deuteron beam
intensity, on the other hand, can be increased by a factor of several thousands. In fact that is probably essential to measure z at E<2 keV. I wish
I had a chance to discuss these details with Kasagi in Sendai. But he was often too busy with other experiments. Let me add another detail; it was
emphasized in his publications. The actually measured quantitiy was not z(E) but the “effective yield,” Y, at various E. The reliability
of conversion depends on the reliability of the dE/dX for low energy deuterons in the bombarded material.
What role do the d projectiles play in low E? Do they directly collide with quazi-stationary deuterium ions in the foil or do they simply contribute
to the pool of D ions residing in the foil? In the first case I would characteroze the D(d,p) as a hot fusion reaction. In the second case I would
say it a cold fusion reaction, like those reported by Jones and Lipson. Why should loading with a beam be different from loading by other means? In
the first case the rapid decrease of the cross section, when E decreases, can be interpreted in the spirit of Gamow’s formula, modified to
account for the unexplained screening. In the second case the situation becomes more complicated, perhaps R decreases because n, in Formula 8,
becomes smaller. How can these two situations be distinguished? Probably by studying the effect of I on R, for a chosen E. In the first case the
dependence should be linear in the second case it should be nonlinear.
References:
1) J. Kasagi, H. Yuki, T. Baba, T. Noda, T. Ohtsuki and A. Lipson; “ strongly Enhanced DD Fusion Reaction in Metals Observed for keV D+
Bombardment.” Journal of the Physical Society of Japan, vol 71, No 12, pp 2881-2885, 2002
2) Several papers of Kasagi et al. can also be downloaded from the library at
<http://www.lenr-canr.org>. Click the “library;” then click the K, for links to Kasagi's papers.
3) L. Kowalski, "Nuclear Cross Sections." The Physics Teacher, 1972, 10, 132.
Click to see the list of links