Click to see the list of links
Ludwik Kowalski; 7/10/2006
Department of Mathematical Sciences
Montclair State University, Upper Montclair, NJ, 07043
This is a continuation of what was in the unit #301. What would happen to the CMNS field if the Mizuno-type excess heat is really shown to be an
illusion? Not much. Mizuno-type experiments were only a small fraction of the EE (excess energy) sub-field. The CF and CT sub-fields (cold fusion
and cold transmutations) cannot possibly suffer from an interpretational error in the case of GDPE (glow discharge plasma electrolysis). The only
negative effect on the entire CMNS field can possibly come from a realization that it took ten years to find a trivial cause of the illusion.
The fact that dominants researchers, Mizuno and Naudin, decided to remain silent when their conclusions were criticized will be noticed. People might
generalize that all CMNS scientists are irresponsible. I hope that this will not happen.
At the beginning of unit #301 I wrote about preliminary results from Scott Little. Last night Scott send me final results. This morning these results
were posted on the CMNS list (restricted Internet list for CMNS researchers). Three different methods were used to determine the percentage of the
electrolyte: the method based on weight (already described in unit #301), the method based on concentrations of potassium (K) and the method based on
concentration of tungsten (W). The XRF (X-Ray Fluorescence) instrument was used to measure the concentrations. How does this method work?
A narrow beam of X-rays is sent on a sample to be analyzed. The atoms in that substance are excited and emit characteristic X-rays. Like in optical
spectroscope, individual elements can be recognized by unique characteristic X-rays. Scott optimized the instrument for the detection of peaks due
to K and W. Once this is done he can compare intensities of characteristic rays, for different samples, with the intensity of a standard in which
concentrations of atoms are known. An example of an XRF spectrum is shown in Figure 1. The abscissa is the wavelength of X ray photons while the
ordinate is the number of accumulated counts. Characteristic wavelengths indicate presence of specific atoms while heights of peaks are proportional
to concentrations of these atoms.
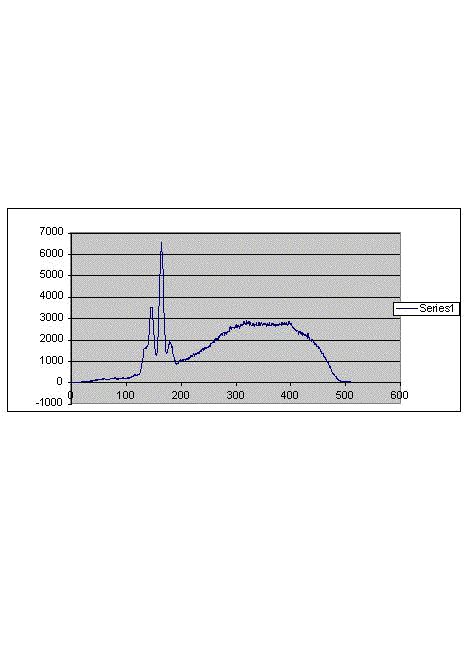
Figure 1
A typical X-ray fluorescence spectrum. Narrow peaks correspond to specific elements. The rest corresponds to the X-rays with which the sample was
bombarded. The tail, under narrow peaks, is the background. Heights of peaks do not include that background. Numbers refer to arbitrary units.
Suppose, for example, that a particular peak is due K (potassium) atoms, as established by a preliminary calibration. How can this help us to
determine the percentage of the electrolyte in the liquid lost during a Mizuno-type experiment? This can be done by comparing two spectra (a) that
due to the sample of the original electrolyte and (b) that due to a samples of condensed liquid escaping from the cell during an experiment. The two
samples must have the same volume, for example 27 cubic mm, and be analyzed under identical conditions. Suppose the height of the K peak in (a) is
8 units (after subtracting the background) while the height of the K peak in (b) is 2 units. Then one would say that concentration of K in (a) is
4 times higher than in (b). It is easy to consider two extreme cases: the escaping liquid is nothing but H2O vapor and the escaping liquid
is nothing but original electrolyte. In the first case the height of the peak for (b) would be zero. In the second case the height of the peak in (b)
would be the same as in (a). The ratio of the peak height in (b) and the peak height in (a), multiplied by 100, is the percentage we are trying to
establish. For the hypothetical 2/8 ratio the contribution of the electrolyte to the escaping liquid would be 25%. That is the essence of the XRF
methodology.
TABLE 1
Figure 2
sample SCA K W % drops % drops % drops %
conctr. conctr. conctr. by SCA by K by W 3 methods
#1 0.21 0.063 0.026 7.66 8.70 6.10 7.49
#2 0.12 0.041 0.026 4.38 5.66 6.10 5.38
#3 0.18 0.054 0.036 6.57 7.46 8.45 7.49
#4 2.74 0.724 0.426 mean = 6.79%
st.dev=1.21%
Summary of results
Figure 2 shows the summary of results. It is based on what was posted by Scott Little last night. He provided numbers in the first four columns, I
added additional columns to show the main conclusions. Sample # 4 was fresh K2CO3 electrolyte; its concentration was 0.2 M.
Samples #1, 2, 3 were
condensed liquids escaping from the electrolytic cell during a Mizuno-type experiment, similar to that in Colorado2. The four samples are identified
in the first column. The next three columns show results obtained by using three different methods. Note that “SCA,” in the second column,
refers to the method described by Scott at the beginning of unit #301. Numbers in that column are weights of solid deposits, in arbitrary units. SCA
stands for a sensitive scale measuring the weights. Likewise, “K” in the third column stands for potassium. The numbers in the third columns
are concentrations potassium atoms, in arbitrary units (heights of potassium peaks in the X-ray spectra). And “W” in the fourth column stands
for tungsten. Numbers in the fourth column are concentrations of tungsten atoms in arbitrary units (heights of tungsten peaks in the X-ray spectra).
The columns 5, 6 and 7 show percentages of electrolyte in the escaping liquid inferred from numbers in columns 2, 3 and 4, respectively. That is what
we really need to calculate the COPs correctly. Let me illustrate this by showing hoe the 8.7% result was obtained for sample #1 by using the K method.
The concentration of K for the sample 4 was 0.724 arbitrary units. The concentration of K for the sample 1 was 0.063 arbitrary units. The peak ratio
is 0.063/0.724 is 0.087 and this translates into 8.7%. Is this result consistent with what one finds by using the tungsten method. According to that
method the percentage of the electrolyte in the escaping liquid is (0.026/0.426)*100 = 6.1%. And what was the percentage of droplets according to the
“weight” method? The answer is (0.21/2.74)*100 = 7.7% Ideally all three methods should give the same result for the experiment in which
sample #1 was collected. But measurements are not ideal. The mean results is (8.7 + 6.1 + 7.7) / 3 = 7.5, as shown in column 8. Results for the samples
#2 and #3 were obtained in the same way.
The main conclusion is that the escaping liquid is not pure H2O steam; several percents of the lost mass is probably
removed as droplets of the electrolyte. We did not take this under consideration when COPs were calculated on the basis of data collected in Colorado2
experiments. All COPs would be significantly lower if percentages of the electrolyte in the escaping liquid was taken under consideration. After posting
that conclusion on the CMNS discussion list (percentages from columns 5, 6 and 7) I found an interesting tutorial about steam at
http://www.spiraxsarco.com/learn/modules/2_2_01.asp
Here is a quote from it; it shows that the issue of "tiny droplets" is far from being new. ". . . Steam with a temperature equal to
the boiling point at that pressure is known as dry saturated steam. However, to produce 100% dry steam in an industrial boiler designed to produce
saturated steam is rarely possible, and the steam will usually contain droplets of water. In practice, because of turbulence and splashing, as bubbles
of steam break through the water surface, the steam space contains a mixture of water droplets and steam. Steam produced in any shell-type boiler
(see Block 3), where the heat is supplied only to the water and where the steam remains in contact with the water surface, may typically contain
around 5% water by mass."
I suppose this is a well known fact. But it is not mentioned in papers or Internet reports with which I am familiar. This can be explained by isolation
in which CMNS research is done. A normal peer review process would certainly forced the authors to take the tiny drops effect under consideration. But
reports published at yearly International Conferences on Cold Fusion, or over the Internet, are not scrutinized by selected experts, as papers published
in mainstream journals. That is one of many undesirable results of exclusion imposed on the CMNS research about 15 years ago. On one hand no evidence
of the pseudoscientific nature of CMNS was offered and on the other hand the field is not recognized as illegitimate. The situation is tragic; how can
it be changed? Many think that this will suddenly happen as a result of commercial success; for example after a 100 kW generator, based on the CMNS effect,
becomes available. I believe that focusing on scientific investigations, rather than on commercial applications, is more appropriate at this time. The CMNS
field should be allow to evolve in the same way as other areas of science.
Let me return to conclusions drawn for Scott’s results. These conclusions are based on a simplifying assumption which is most likely not valid.
Ideally one need four samples #4, each removed from the electrolyte (with a pipette) only a moment before the experiment during which the corresponding
sample (#1, #2 and #3) is condensed. We do not know what concentrations of the electrolyte were at the beginning of these experiments. I simply assumed
that the concentration in sample #4 was the same as in the original electrolyte, and that fresh original electrolyte was used before each experiment. One
can imagine several scenarios in which the inferred percentages of tiny droplets would be higher than shown in my table above.
For example, suppose that samples #1, #2 and #3 were extracted after a considerable delay. During that delay a significant fraction of the original
electrolyte evaporated and replaced by distilled water. Knowing this one would correct concentrations of in sample #4 (for each of methods) , accordingly.
The values would become smaller than those shown in my table. Suppose they become two times smaller. That would make all percentages two times larger.
The mean of three means, 6.79% would become 13.58%. The COPs obtained during the three experiments, without accounting for the escaping electrolyte were
close to 1.1. These values would have to be reduced to less than 1.0 for the 13.58% correction.
The bottom line is that conclusions made in my table are not reliable. Better experiments must be conducted. My suggestion is to use fresh electrolyte
in each experiment, to extract samples of liquid electrolyte moments before experiments in which samples #1, #2 and #3 are extracted. Actually, three
samples is hardly enough; we need 5 to 10 samples get reliable means and standard deviations (bars of errors). Will this be done in Paris3 and Marseilles1
experiments? I hope so. Will this be done to correct the COP’s reported after the Colorado2 experiments (mean 1.24, st.dev = 0.13). It depends on us,
the authors of the anticipated Colorado2 paper. I think that a simple CLA method of estimating percentages would be sufficient.
Appended in 7/13/06):
In a message posted today at the CMNS list I wrote that the problem that was labeled “tiny droplets” is far from being
resolved. That contradicts what I wrote here earlier.
The mechanisms by which droplets of electrolyte are ejected are certainly worth investigating. But I would not start investigating them at this time,
except in the context of our main question. That question is "should the total mass, M, lost during a GDPE experiment, be used to calculate thermal
energy lost via vaporization?" The initial answer was "yes," the COPs were calculated from the uncorrected M in Colorado2. Then the
question of tiny droplets was raised. We concluded that the mass used to calculate a COP should have been M-m, where m is the mass of escaping droplets
of the electrolyte. Scott suggested a method for estimating m on the basis of weights of solid residuals, as explained at the beginning of unit #301.
That method was based on the expectation that the major component of solid remains, in two samples (initial electrolyte and condensed steam), would be
K2CO3. But his XRF method revealed presence of tungsten. The original electrolyte cannot possibly contain a lot of tungsten; presence of W in that
liquid was a proof that sample 4 was not extracted from the initial electrolyte. That is why another set of samples must be analyzed. But a significant
amount of W in solid remains from samples 1, 2, and 3 is alarming, as recognized by Peter Gluck. Let me elaborate.
First let me refer to the SCA method (explained by Scott at the beginning of unit #301). My conclusion, for example for Sample 1, was that m was 8.8%
of M. But that was done by assuming that solid deposit in Sample 1 were chemically the same as in Sample 4 (the original electrolyte). But suppose that
one half of the solid remains from Sample 1 was tungsten. Knowing this I would conclude that m was 4.4% of M, not 8.8%. And m would become 2.2% of M
if 75% of the solid mass, in remains from Sample 1, were due to tungsten. To remove the ambiguity I would ask a chemist to extract tungsten from the
Sample 1, before it is dried and weighted. Would the SCA method become reliable? Not really. It would be reliable only if other elements were not
present, AND if only tiny droplets were responsible for the removal of the K and W, from the cell. Without these preconditions Scott's SCA method,
as used in my table (see unit #302), could not be trusted, even if Sample 4 were extracted from the initial electrolyte. To make that method useful
one must make sure that dominant non-water component, in all samples from condensed steam, is potassium.
But that is not all. How can we be sure that potassium, found in samples 1, 2 and 3, was removed from the beaker by tiny droplets? We simply assumed
that this was the case. Suppose that K and W are removed from the cell as tiny colloidal particles present in the boiling electrolyte. The particles
can be either dry or wet. Suppose they are dry. In that case a large concentration of K, found in the solid remains of condensed steam, could not be
used as an indicator that m was large. One can easily have a situation in which m<<M while the concentration of K in the sample is not negligible.
In other words, contrary to what I wrote in unit #302, we have no convincing evidence that the actually measured M must be corrected. How can one show
that colloidal particles are "nothing to worry about?"
Click to see the list of links