Click to see the list of links
335) On emission of nuclear particles caused by electrolysis
Ludwik Kowalski; 9/20/2007
Department of Mathematical Sciences
Montclair State University, Upper Montclair, NJ, 07043
Abstract:
Abstract:
Numerous tracks of charged nuclear particles, emitted during electrolysis, were discovered by Oriani and Fisher (3). More recently, residual activity -- emission
of nuclear particles after electrolysis -- was discovered by Oriani (5). This presentation, prompted by my participation in The Galileo Project, describes ten
experiments conducted to replicate the reported results. Common CR-39 detectors were used in these experiments. A total of eight clusters of tracks were found in two
out of six electrolysis experiments. Three clusters were also found in one of four experiments conducted to study residual activity. But track densities outside
clusters were always essentially the same as on control chips. Arguments are presented against trivial explanation of clusters, such as natural
radioactivity and cosmic rays.
1) Introduction
1) This is an investigation of claims (1,2,3,4) that charged nuclear particles are occasionally emitted during electrolysis. The accepted point of view is that
chemical processes (interactions involving outer electrons in atoms and molecules) are too weak to produce emission of nucleons from atomic nuclei. Yet, several
qualified researchers, such as A. Lipson, R. Oriani and S. Jones, have been reporting unexpected emission of nuclear particles, for many years. Experimental facts
that conflict with existing theories should be studied rather than rejected. My study was prompted by a recent report of Richard Oriani (5), and by participation
in The Galileo Project (6). Oriani discovered, by using CR-39 detectors, that nuclear particles are emitted during electrolysis. Later he discovered that particles
are also emitted after electrolysis. I will refer to what happens during electrolysis as “Oriani effect” and what happens
after electrolysis as “residual activity.” The first effect has been studied by Oriani for several years. In the spring of 2007, Oriani‘s recent
results were posted on the discussion list for CMNS researchers. The report shows that unexplained effects were observed in more than twenty consecutive experiments.
2) High level of reproducibility, according to Oriani, is due to residual activity. Each consecutive electrolysis experiment presumably benefits from what happens during
the previous experiment. The probability of triggering Oriani effect in a new electrolytic cell is said to be very low, but it becomes very high after the first success.
That is why having a residually active O-ring became part of the protocol offered to researchers, like myself, who tried to validate the claims. The first experiment
had to be performed with O-rings removed from Oriani's cell, shortly after electrolysis, and received by one of us about 24 hours later. Subsequent electrolysis
experiments, with the same O-rings, were expected to reliably reproduce the effect. According to Oriani‘s paper (5), distributions of tracks left by nuclear
particles on CR-39 detectors are mostly uniform, more or less. But sometimes tracks appeared in the form of small clusters. The following five nuclear phenomena were
identified:
a) production of clusters of tracks during electrolysis
b) production of unclustered tracks during electrolysis
c) production of clusters of tracks after electrolysis
d) production of unclustered tracks after electrolysis
e) residually active (seeded) O-rings, in a cell, increase the probability of (a) and (b).
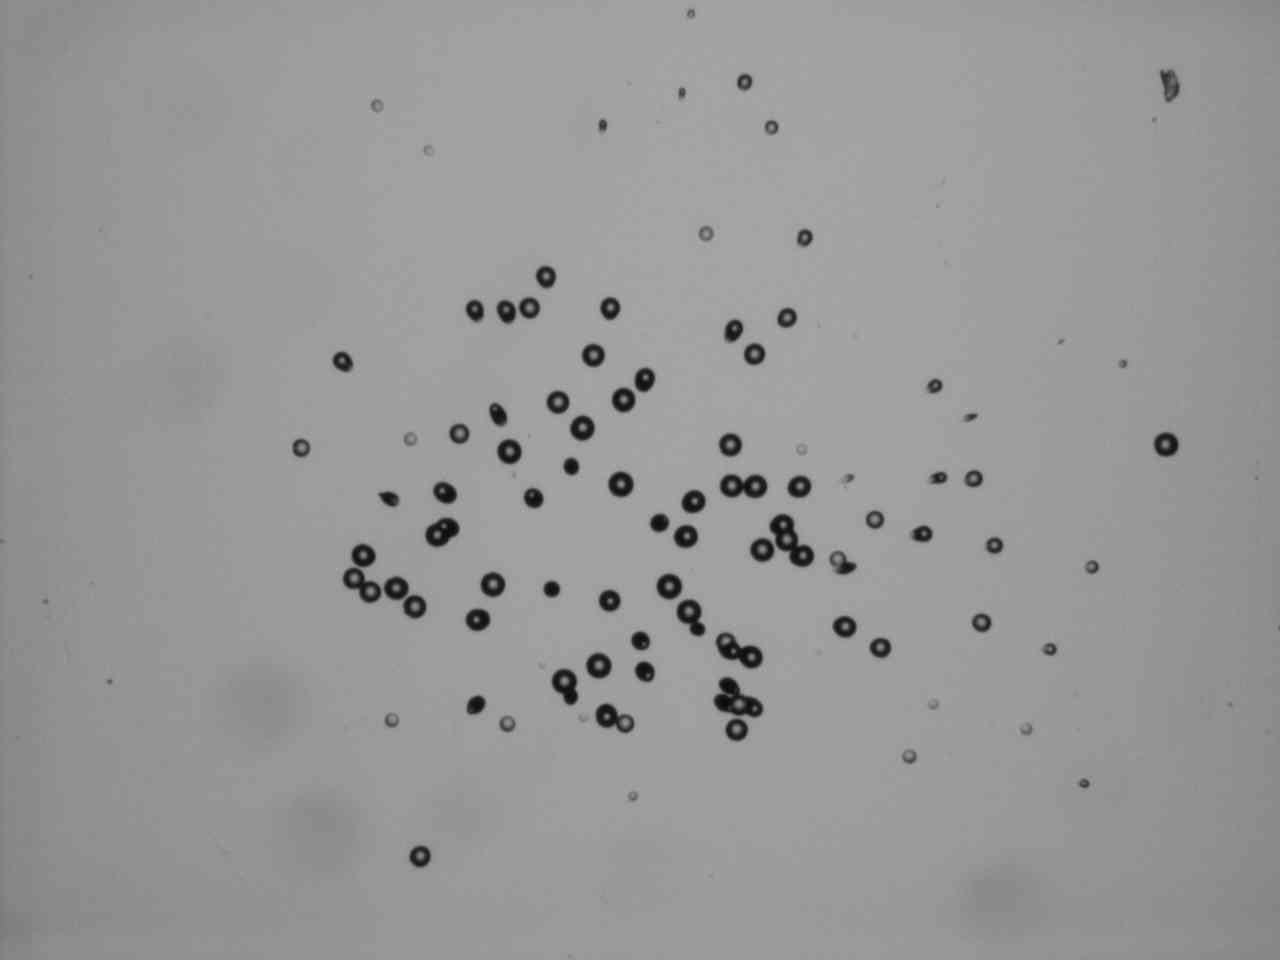
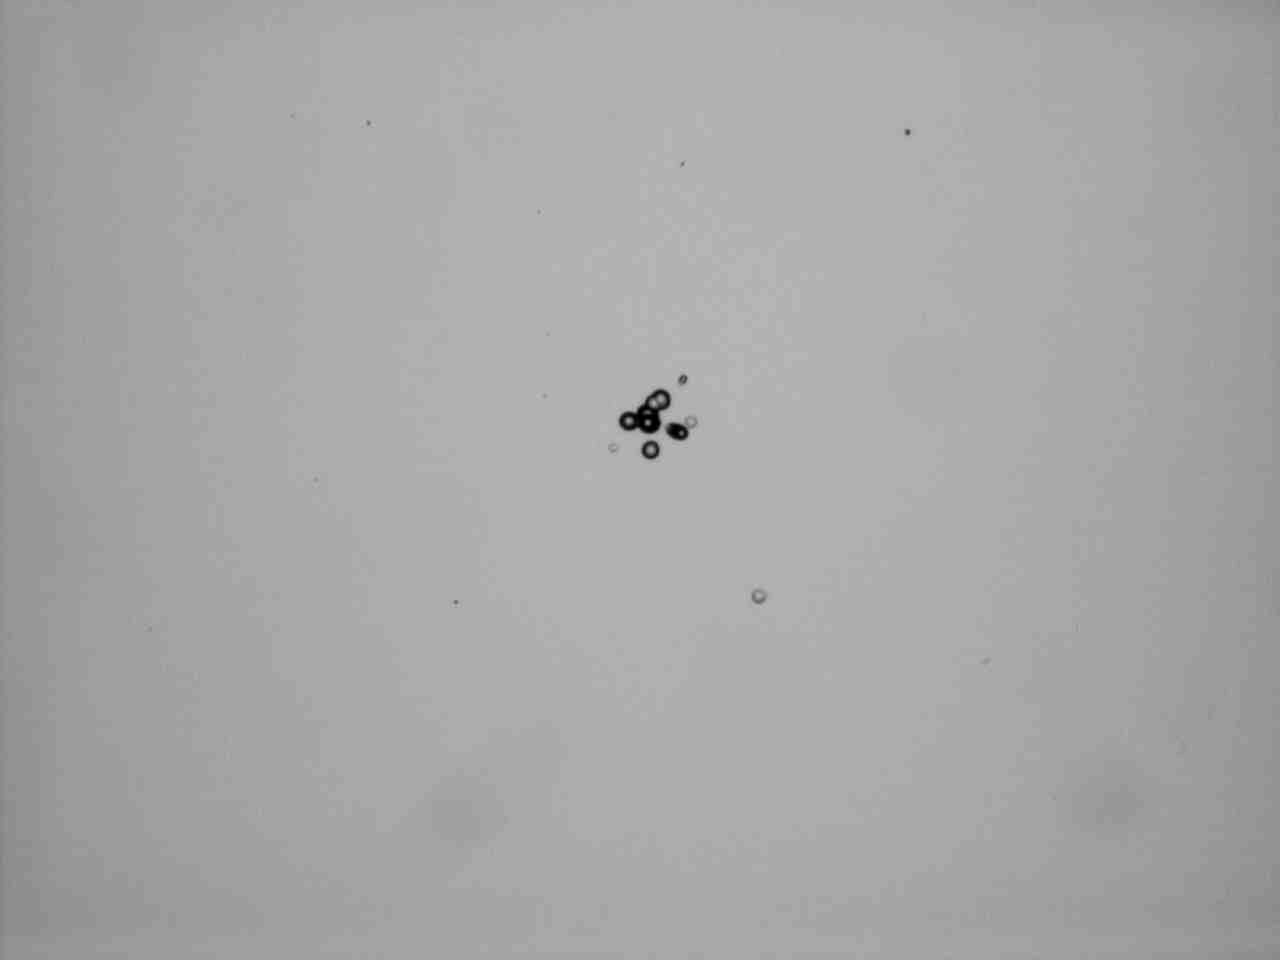
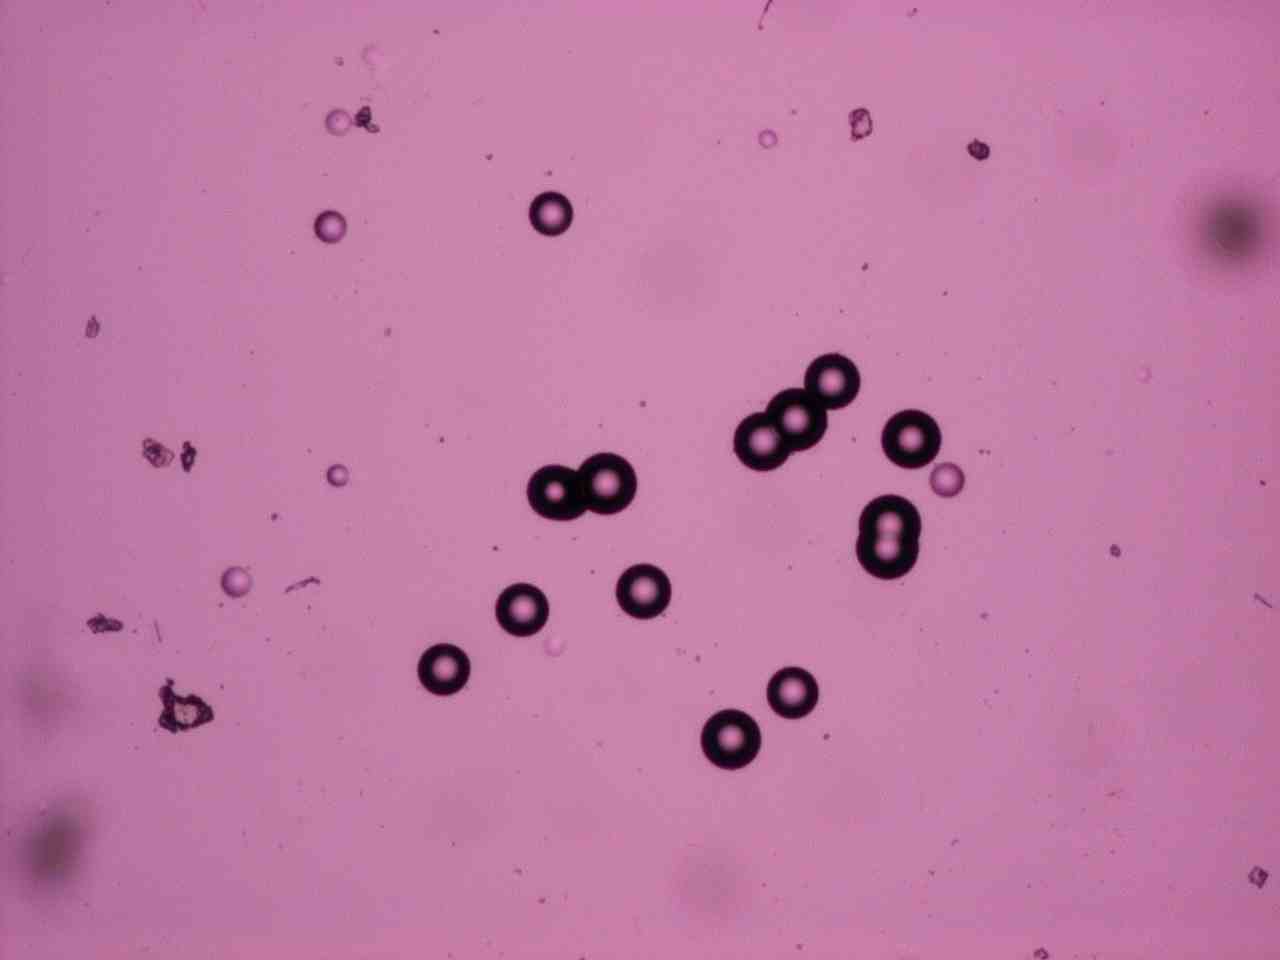
3) A spectacular cluster of residual activity tracks, shown in Figure 1, was recorded by Oriani during a recent experiment. In showing this photo, Oriani, wrote; “this
cluster was produced in a residual effect experiment. An o-ring previously used in an electrolysis run was placed upon a detector chip and the whole wrapped in aluminum foil,
then etched after three days. The very interesting fact is that the cluster appeared not on the detector surface upon which had been placed the o-ring but rather on the
opposite side of the chip. Furthermore the latter side had remained covered by the manufacturer-supplied blue plastic protective film throughout the experiment. Try to
explain this as a result of radioactive contamination !” The blue protective film is thick enough to stop alpha particles from radioactive substances.
= = = = = = = = = = = = = =
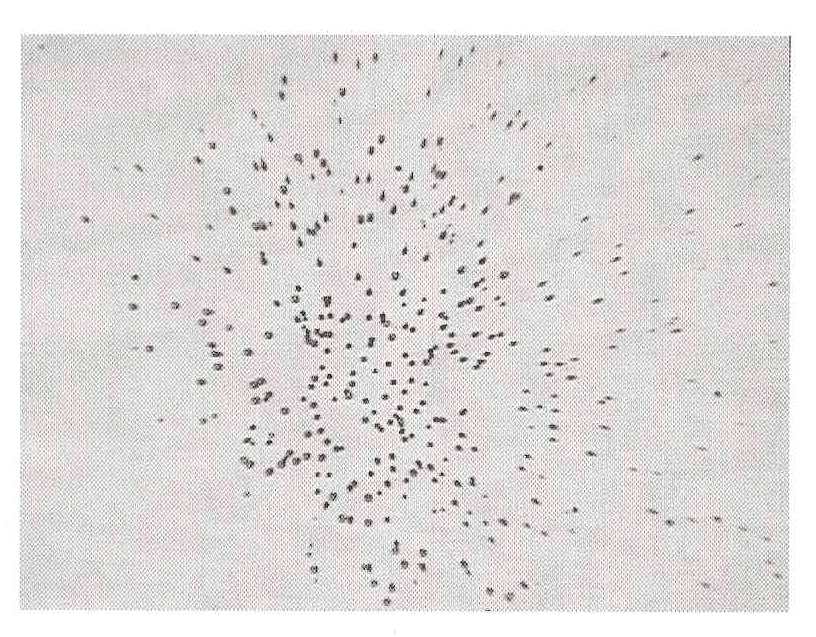 .
. Figure 1
A cluster produced during Oriani‘s residual activity experiment lasting three days. The magnification is X100; the photographed area is approximately 950 by 760 microns.
= = = = = = = = = = = = = = = = = = = = = = = = = = = =
What follows describes my simple apparatus and my results. In the closing section I will argue against the idea that clustered tracks are due to natural radioactivity or cosmic rays. Paragraphs are numbered to facilitate discussion over the Internet.
2) Experimental setup and its use.
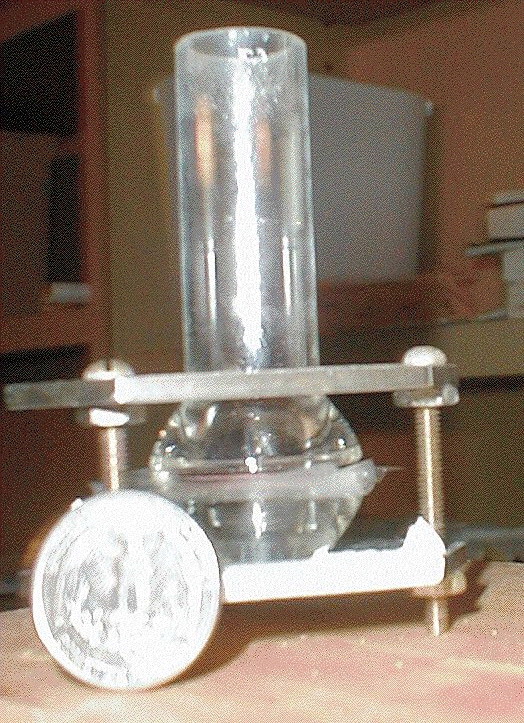
4) The electrolytic cell used in my experiments was identical to one of Oriani’s cells, as schematically illustrated in Figure 2. The electrolyte was Li2SO4 in ordinary distilled water; the concentration was 22 grams per liter, as recommended by Oriani (5). The anode was Pt and the cathode was Ni. The cell was a glass tube containing about 10 cc of the electrolyte. The bottom of the tube was made from a replaceable 3 by 3 cm chip of CR-39 plastic material. That chip (thickness about 1 mm) was separated from the electrolyte by a layer of mylar whose thickness was 6 microns.The Ni-wire cathode, in the form of a spiral pancake, was in contact with the mylar while the Pt-wire anode, also in the form of a spiral pancake, was about 15 mm above the cathode. Potential differences applied to the cell were between about 5 and 12 volts, depending on the desired current (between 30 mA and 150 mA during preliminary experiments). At 3 V the current was close to zero. The concentration of the electrolyte was allowed to double (approximately) during experiments because water lost via electrolysis was usually not replaced till the volume of the electrolyte was reduced to approximately one half of the initial volume. The current, however, was kept constant, usually 42 mA, by an electronic stabilizer outside the power supply.
= = = = = = = = = = = = = =
 . (B) -->
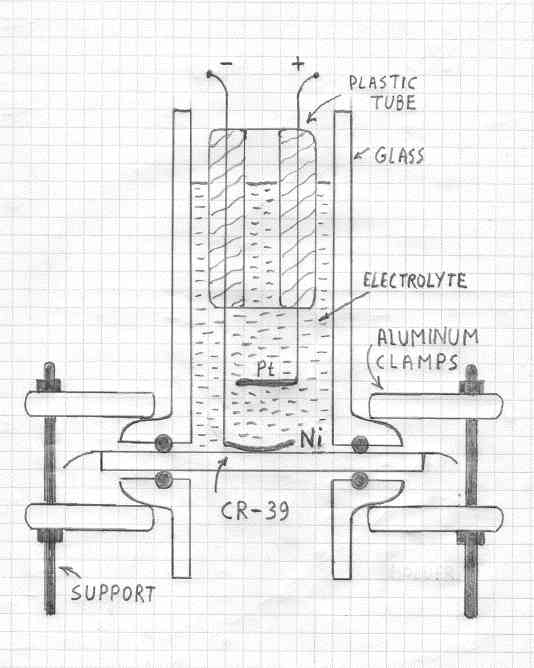
Figure 2
(A) The empty electrolytic cell and (B), its schematic diagram (showing the inner components). The diameter of the coin is close to 25 mm. The Ni cathode is separated from the CR-39 chip by a mylar foil whose thickness is 6 microns. Two flexible Viton O-rings are pressed against the CR-39 chip to prevent leackage of the electrolyte.
= = = = = = = = = = = = = = = = = = = = = = = = = = = =
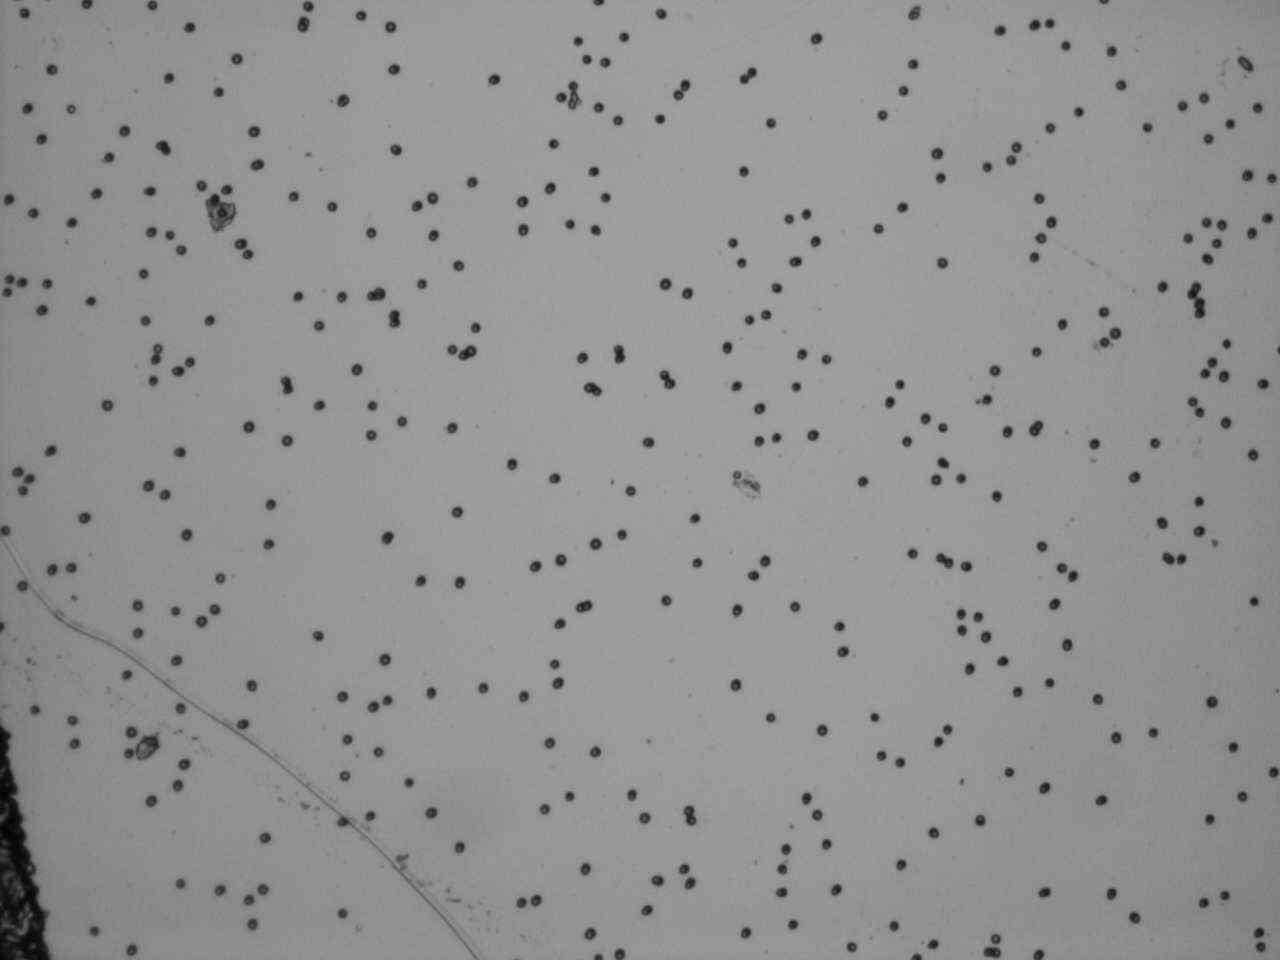
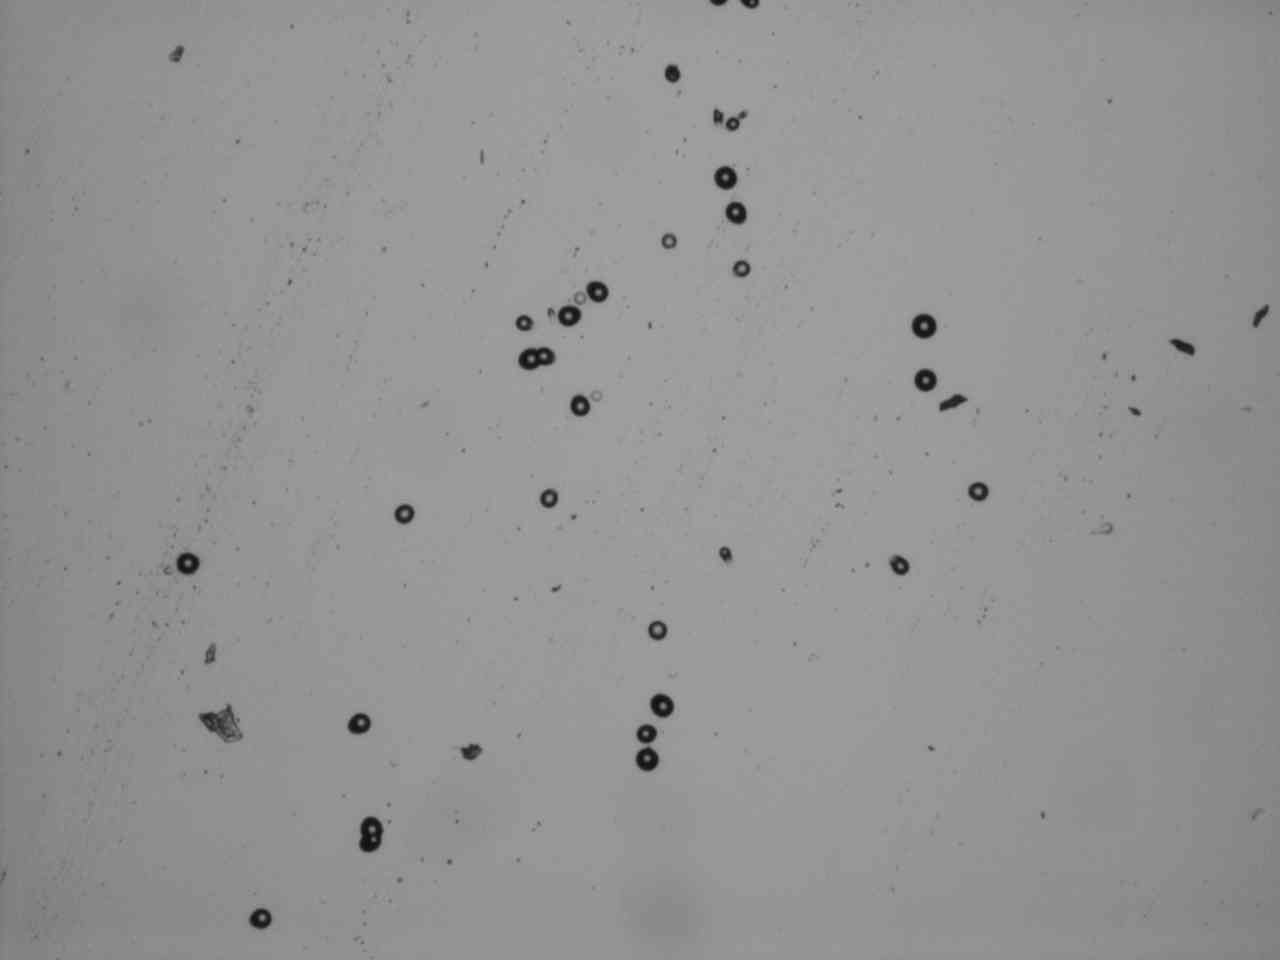
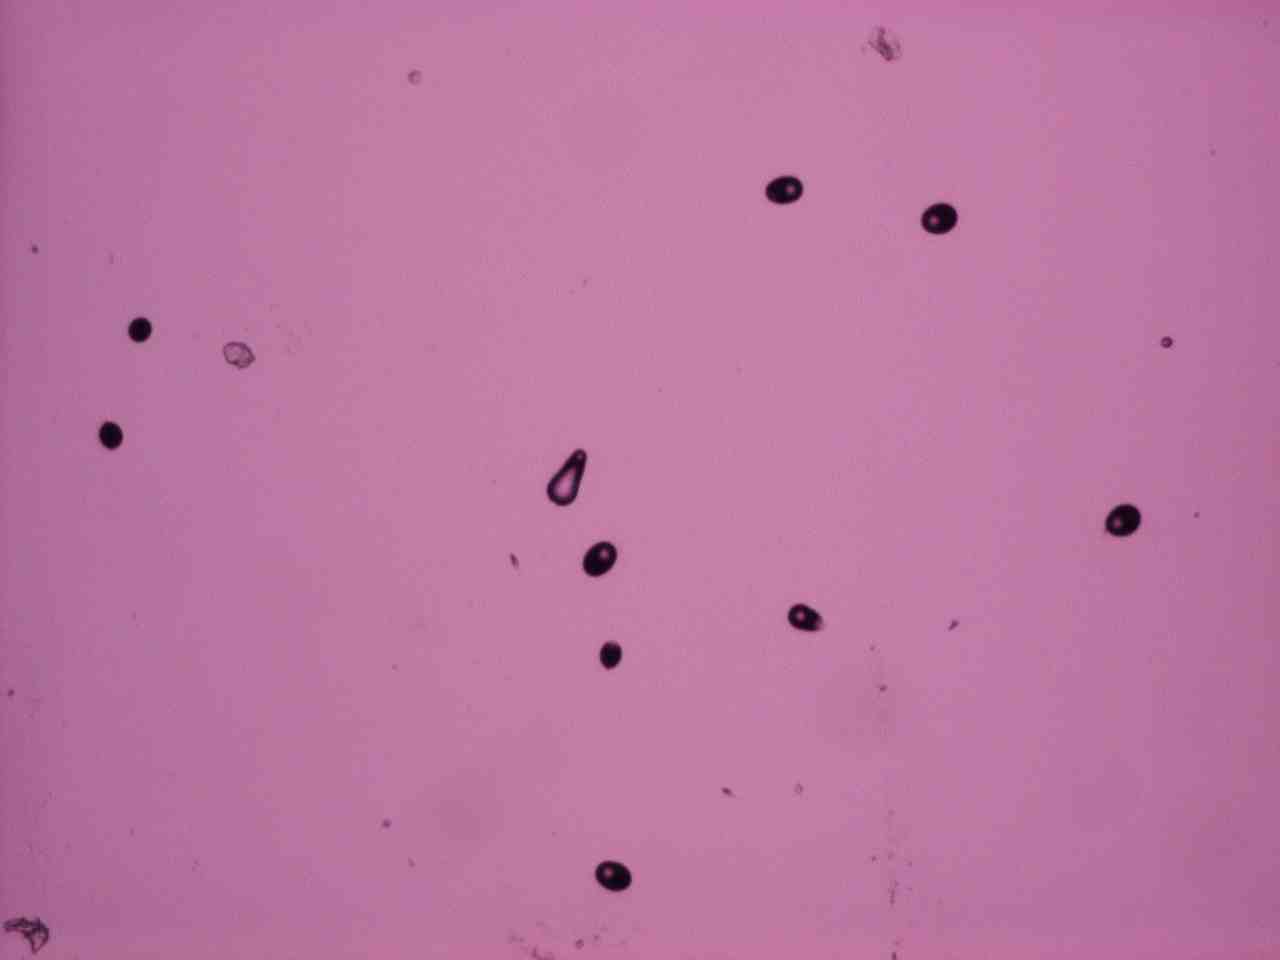
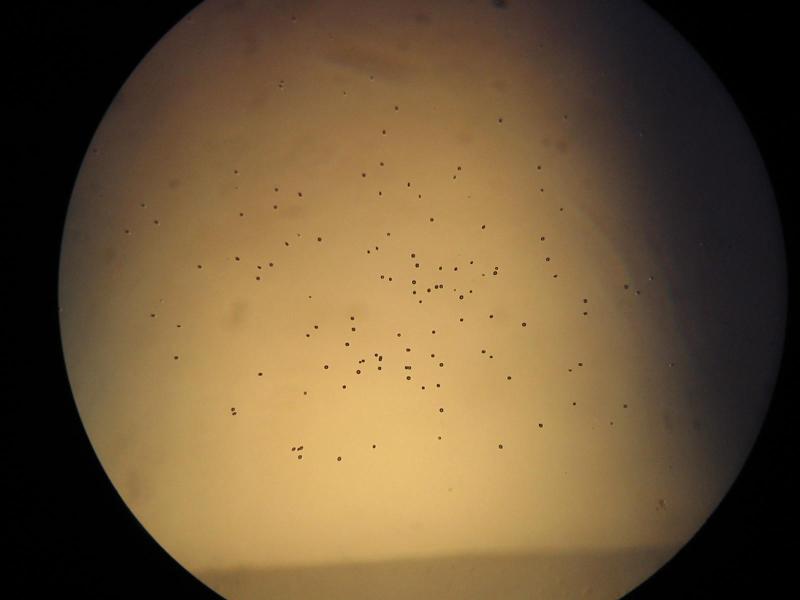
5) The CR-39 chips were cut from a Fukuvi Chemical sheet purchased from Landauer Inc. (7) One of the well known properties of CR-39 material is its ability to record tracks of nuclear projectiles, such as protons or alpha particles (8), as illustrated in Figure 3. (A) shows tracks due alpha particles from an 241Am source; (B) shows a cluster of tracks due to a tiny grain of radioactive material. To make tracks visible, under a microscope, CR-39 chips were etched in the 6.25 N solution of NaOH, at 72 C, for 6 hours.
= = = = = = = = = = = = = =
(A)
 . (B)
. (B) 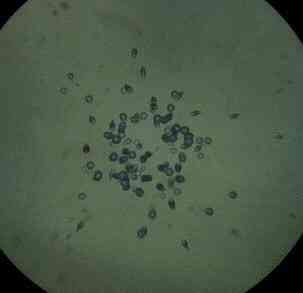
Figure 3 (A) Tracks of alpha particles from an americium source. Surface imperfections and dust particles can also be seen. The photographed area is 1000 by 1300 microns; magnification is X40. (B) An island of tracks around a grain containing uranium. This photo was provided by Scott Little. The magnification in (B) was higher than in (A); etching conditions were also not the same.
= = = = = = = = = = = = = = = = = = = = = = = = = = = =
6) According to (5), numbers of alpha-like tracks, produced in CR-39 during the electrolysis, greatly exceed the numbers of tracks on control chips. The densities of tracks in control chips fluctuated between approximately 5 and 25 tr/cm2. The densities on electrolysis chips, on the other hand, were most often several hundred. In some cases they were "too high to count." My experiments failed to confirm these observations, except for small clusters of tracks. Oriani’s paper has a table with numerical results (track densities) from about 20 consecutive experiments. The label C, which stands for “cluster” appears 14 times in his table. It indicates that clusters of tracks were often observed. By my definition a cluster is an island of many tracks surrounded by track-free areas, as illustrated in Figure 1. In this paper I will describe results from ten experiments: I, II, III, IV, V, VI, VII, VIII, IX and X. The first six of them were performed to study the (a) and (b) effects, described in Section 1. The last four experiments were performed to study the effects (c) and (d). What follows is a brief description of these experiments. Pictures of my clusters will be shown in Sections 3 and 4.
** Electrolysis in Experiment I lasted 5 days, using Oriani’s seeded O-rings. The rings were received 24 hours after they were removed from Oriani’s cell. The experiment started shortly after the package arrived.
** Electrolysis in Experiment II lasted 21 days, using the same O-rings as in Experiment I. The experiment started shortly after the end of Experiment I.
** Electrolysis in Experiment III lasted 5 days, using the same O-rings as in Experiment II. The experiment started shortly after the end of Experiment II.
** Electrolysis in Experiment IV lasted 5 days, using another freshly seeded O-ring from Oriani. The experiment started shortly after that O-ring was received.
** Electrolysis in Experiment V lasted 5 days, using the same O-ring as in Experiment IV. The experiment started shortly after Experiment IV.
** Electrolysis in Experiment VI lasted 5 days, using the same O-ring as in Experiment V. The experiment started shortly after the end of Experiment V.
**** Experiment VII was conducted outside the electrolytic cell. Several small CR-39 chips were applied, for two days, to O-rings used in experiment III.
**** Experiment VIII was also conducted outside the electrolytic cell. Two large CR-39 chips were applied, for two days, to another freshly seeded O-ring sent to me by Oriani.
**** Experiment IX was similar to Experiment VIII, except it started at the end of Experiment VIII.
**** Experiment X was similar to Experiment IX, except it started at the end of Experiment IX.
7) Four clusters of tracks were found on the electrolysis chip from Experiment I, zero clusters were found on the electrolysis chip from Experiment II and four clusters were found on the electrolysis chip from Experiment III. Experiments IV, V and VI failed to produce clusters. Zero clusters were found in Experiment VII. But three clusters were found in experiment VIII. Experiments IX and X also failed to produce clusters. In all ten experiments, track densities outside clusters were found to be essentially the same as on control chips. In other words, effects (b) and (d) were not produced in my experiments.
3) Clusters of tracks:
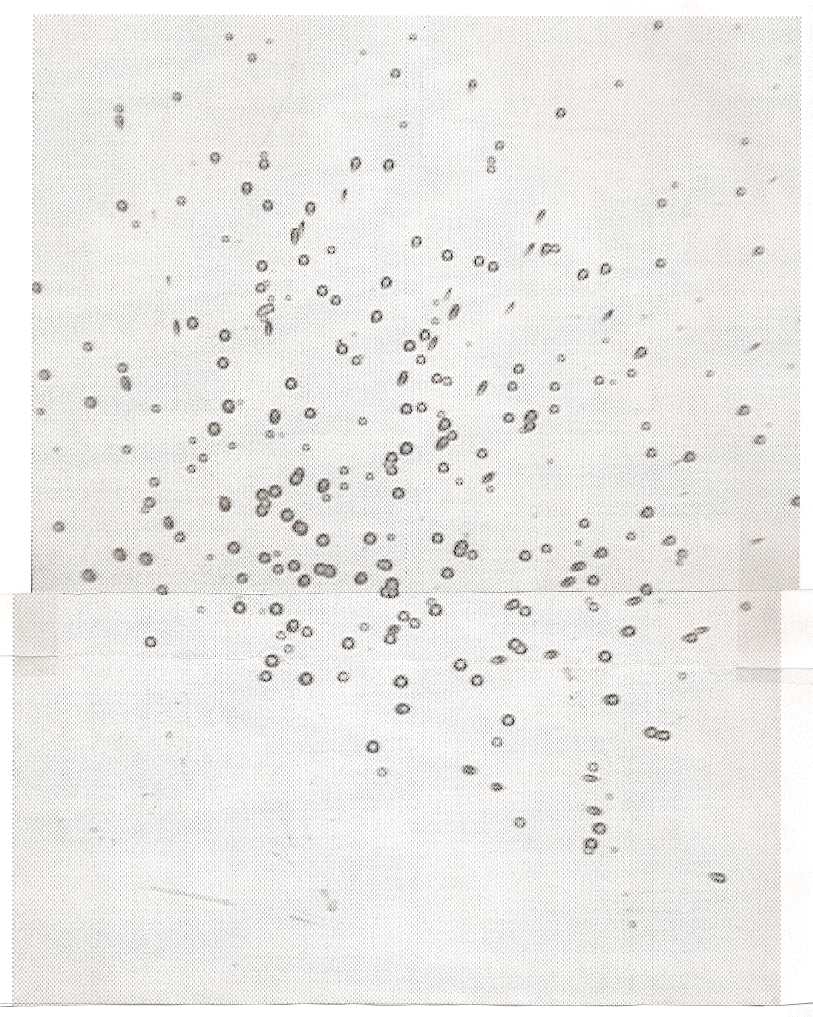
Figure 4 shows the first cluster found in Experiment I. It occupies an area larger than other clusters produced on the same CR-39 chip. That is why two fields, (A) and (B), were needed to show all of its tracks. Tracks in that cluster seem to be less dark (shallower ?) than tracks on others clusters.
= = = = = = = = = = = = = =
(A)
 . (B)
. (B) 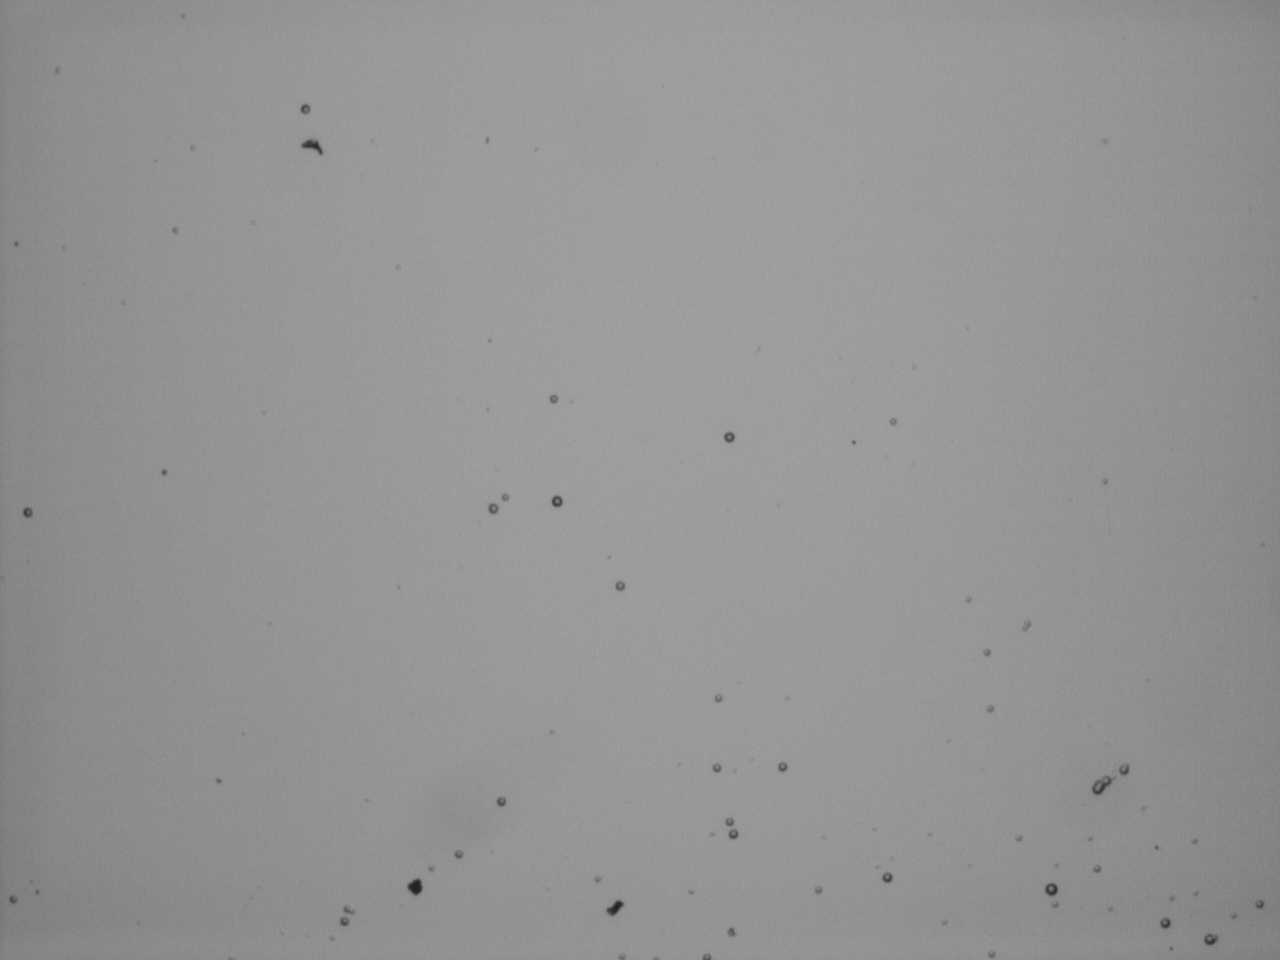
Figure 4
Tracks of my largest cluster. It was produced during electrolysis Experiment I. Each of the two photographed areas is a field of 1000 by 1300 microns; magnification is X40. Most of the tracks appear in the field (A); the field (B) shows the remaining tracks of the same cluster. Some tracks in the upper part of (A) can also be seen in (B). The background outside the cluster was most often less than one track per field.
= = = = = = = = = = = = = = = = = = = = = = = = = = = =
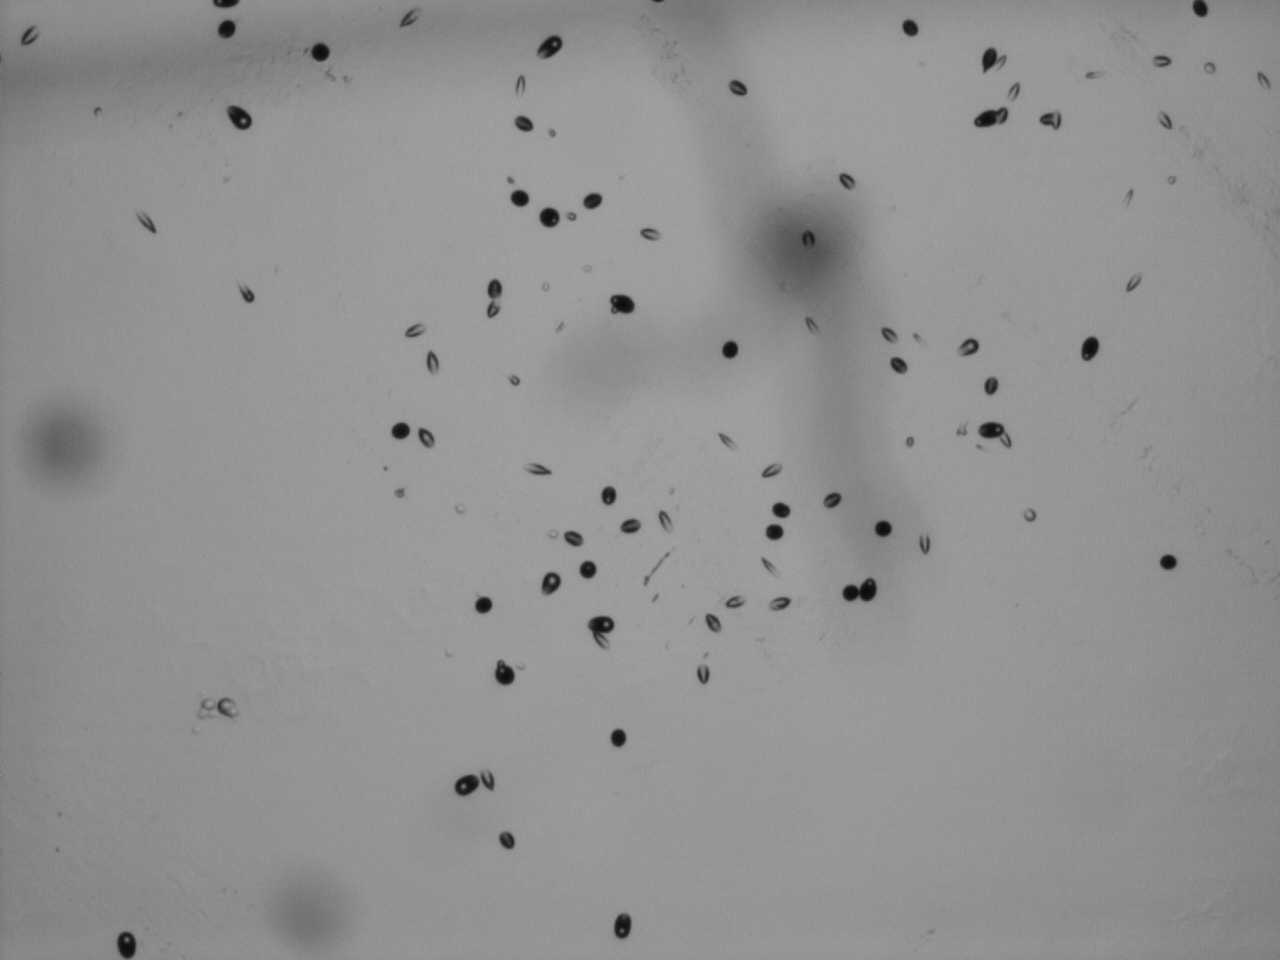
8) Two smaller clusters, with much darker tracks, are shown in Figures 5A and 5B. Note that tracks of the cluster of Figure 5A are mostly circular while a large fraction of tracks in the clusters of Figure 5B are conical or elliptical. Significance of non-circular tracks will be discussed later.
= = = = = = = = = = = = = =
(A)
(B)
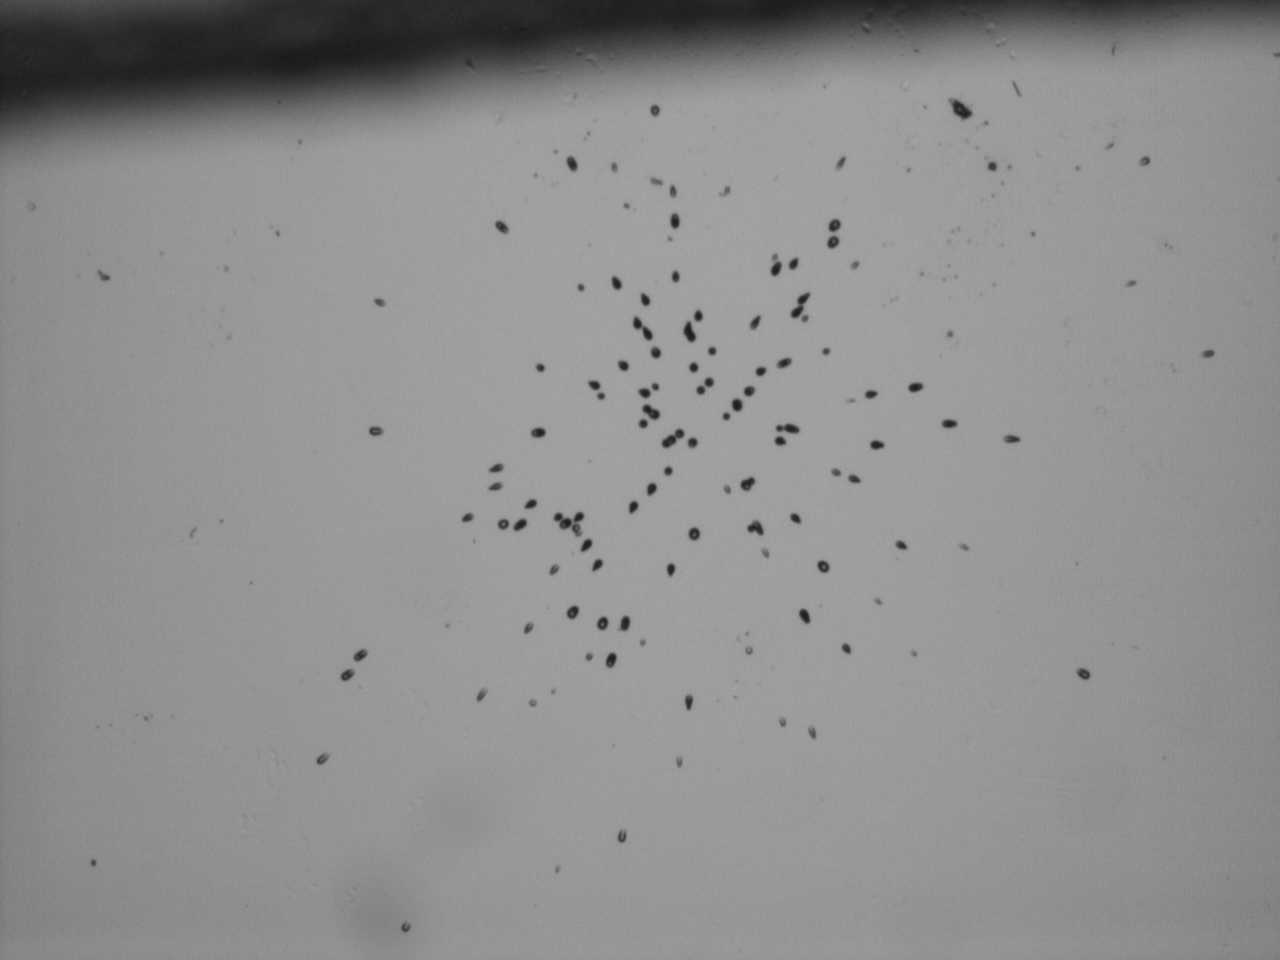
Figure 5 (first A then B)
Two clusters also produced during my electrolysis experiment I. Each photographed area is 1000 by 1300 microns; each magnification is X40. The etching time was 6 hours. Figure 8 will show the same cluster after additional 5 hours of etching.
= = = = = = = = = = = = = = = = = = = = = = = = = = = =
9) Not a single cluster of tracks was found on the control chip. This is significant in the context of a discussion that subsequently evolved over the Internet. Little and Little (9) also recorded clusters by using seeded O-rings. But they suspect that clusters might be due to tiny particles of radioactive material, such as uranium or radium. Figure 3A shows a cluster of tracks around a grain of uranium-containing material; they deliberately deposited it on CR-39 to illustrate the effect. My control chip had the same history as my electrolysis chip. In Section 6 I will explain why, in my opinion, the cluster shown in Figure 5B, and Oriani's cluster shown in Figure 1, cannot be due to a tiny spot of alpha-radioactive contamination. Several non-circular tracks, under ten times higher magnification, are shown in Figure 6. They belong to the cluster shown in Figure 5B.
= = = = = = = = = = = = = =
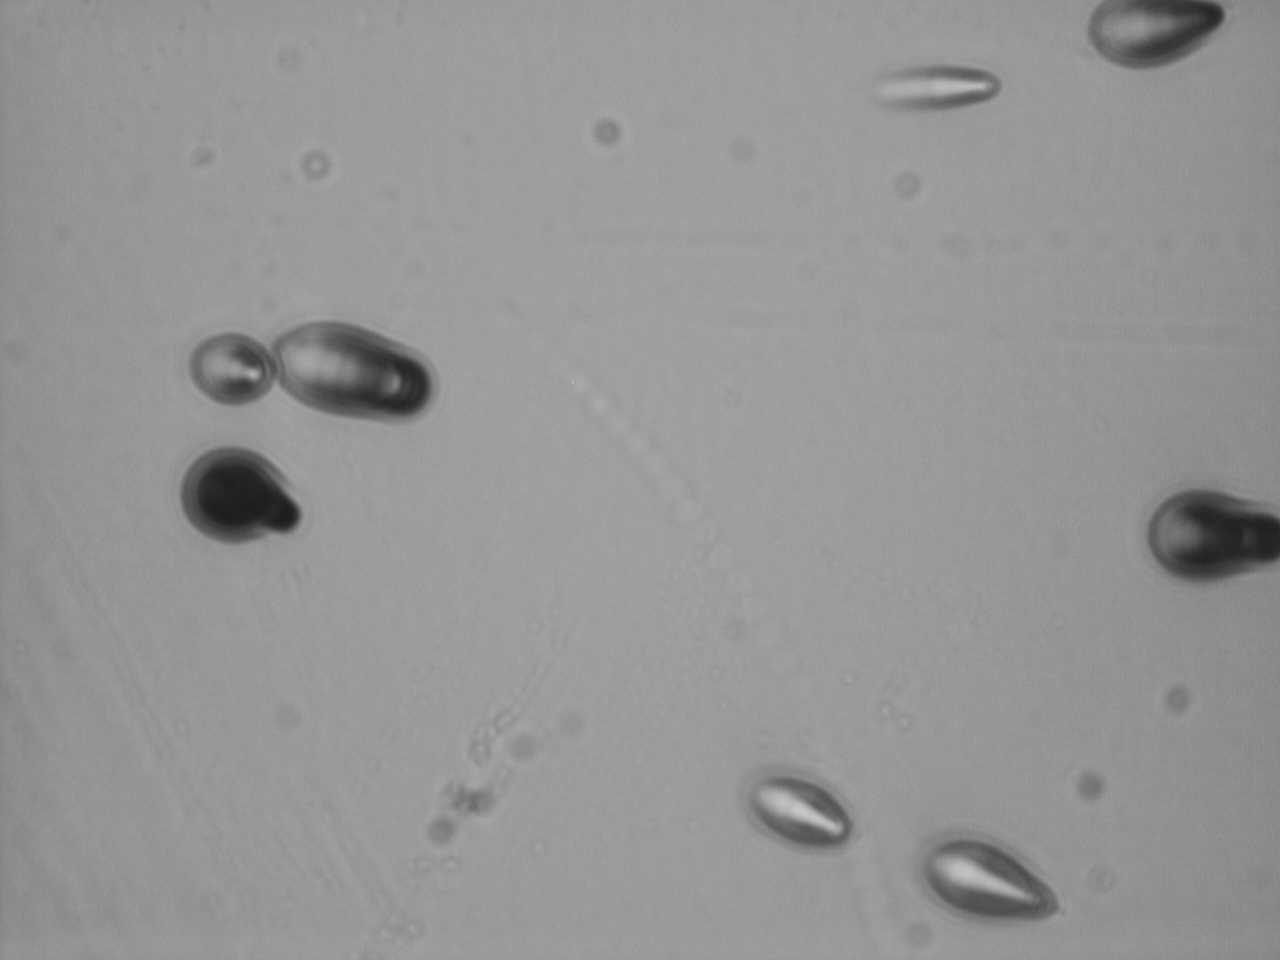
Figure 6
Some elliptical and conical tracks under the magnification of X400. The photographed area is 100 by 130 microns.
= = = = = = = = = = = = = = = = = = = = = = = = = = = =
10) The fourth cluster, produced during the experiment I, was not photographed when the chip was examined after 6 hours of etching. I probably misidentified it as the already-photographed island of tracks. But the fourth cluster was immediately recognized after an additional 5 hours of etching. The photograph of that cluster, with much larger tracks (due to additional etching) is shown in Figure 7.
It is remarkable that average track densities, within clusters, are very much higher than the mean 15 tr/cm2 background. For the cluster shown in Figures 5A the local density was close to 6000 tr/cm2; this is 400 times higher than the mean background. For the cluster shown in Figures 5B the local density was close to 25000 tr/cm2; this is about 1700 times higher than the expected background. For the cluster shown in Figures 7 the local density was close to 20000 tr/cm2. This is again three orders of magnitude above the background. Additional etching did not produce many more excessive tracks, as expected by Oriani. The large cluster, shown in Figures 4A and 4B also had about 90 tracks. But the area covered by these tracks was larger than for other clusters. The mean local density, for that cluster, turned out to be close to 7000 tr/cm2.
= = = = = = = = = = = = = =
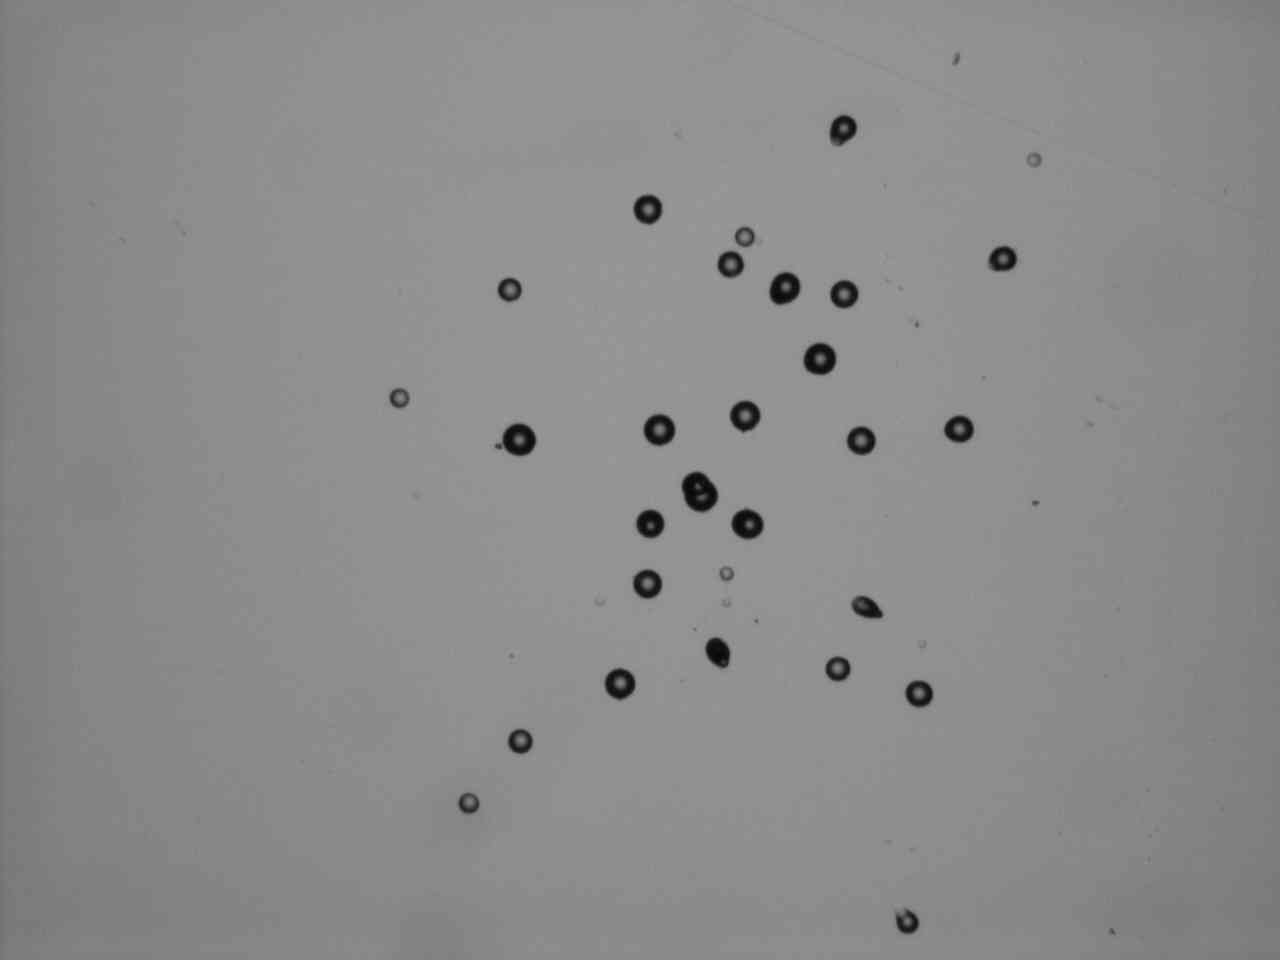
Figure 7
Another cluster from experiment I, after 11 hours of etching. The photographed areas is 1000 by 1300 microns; magnification is X40.
= = = = = = = = = = = = = = = = = = = = = = = = = = = =
11) One detail is worth mentioning before describing results from other electrolysis experiments. Comparing Figure 5B and Figure 8, which are photos of the same cluster, one can see that many tracks that were elliptical in Figure 5B became nearly circular in Figure 8. That was an important lesson; over-etching makes counting easier but it tends to destroy important information. In fact, etching for only 4 hours, instead of 6 hours, is likely to be more desirable, when information provided by orientation of tracks is important.
= = = = = = = = = = = = = =
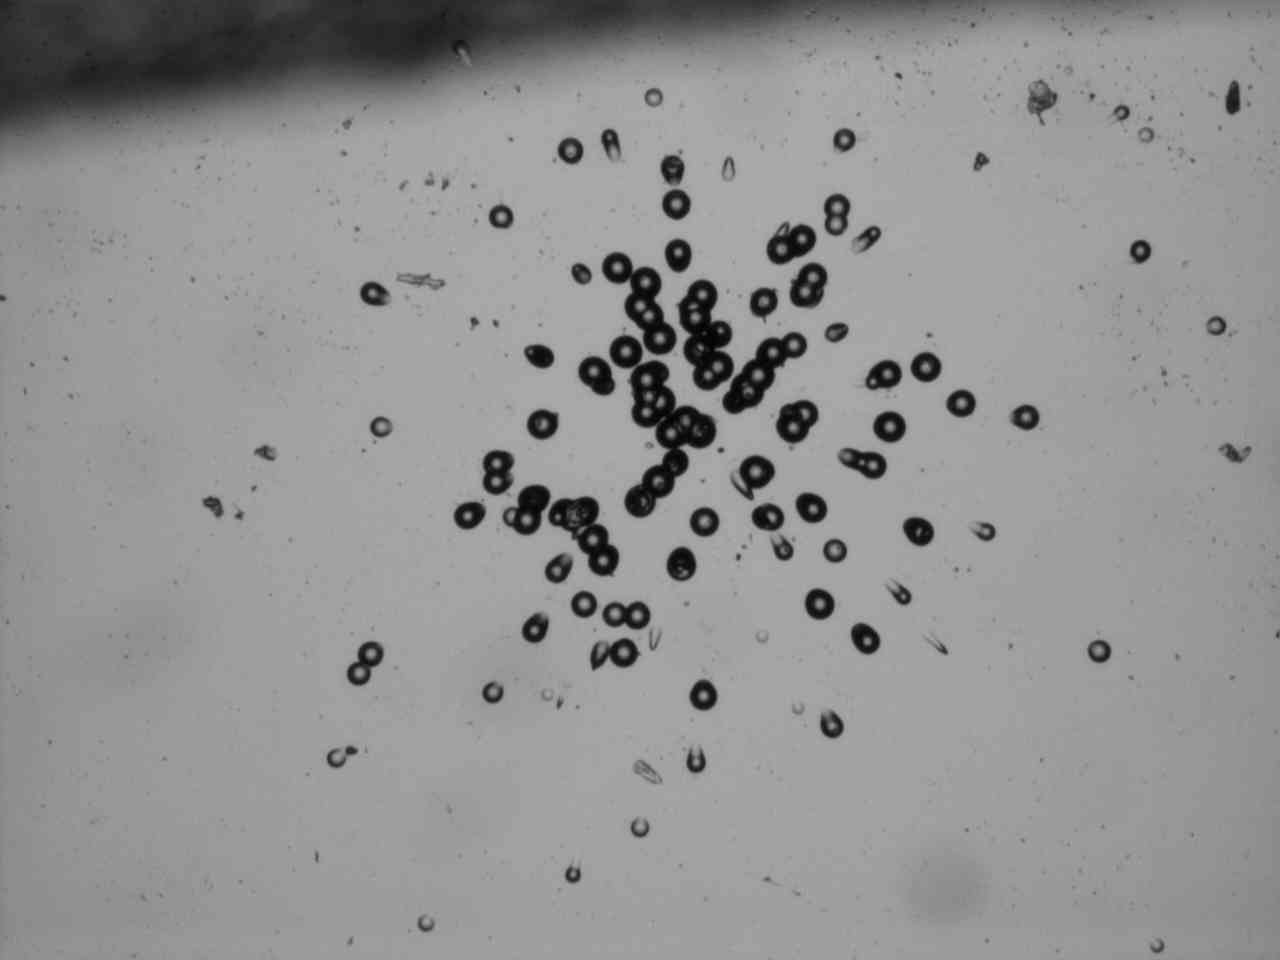
Figure 8
Same cluster as in Figure 5B but after 11 hours of etching. The photographed areas is 1000 by 1300 microns; magnification is X40.
= = = = = = = = = = = = = = = = = = = = = = = = = = = =
12) Not a single cluster, or excessive average track density, was found on the CR-39 chip used in Experiment II. It is easy to show that the probability of not recording a single cluster in 21 days, when four clusters were produced in 5 days, would be very low for random fluctuations. An important precondition for Oriani effect was probably not satisfied during experiment II. Clusters are not reproducible on demand. But Experiment III again produced four clusters. Three of them are shown in Figures 9A, 9B and 10A. Track densities within these clusters are 24000 tr/cm2, 615 tr/cm2 and 2385 tr/cm2, respectively. Experiments IV, V and VI, however, failed to produce clusters.
= = = = = = = = = = = = = =
(A)
 . (B)
. (B) 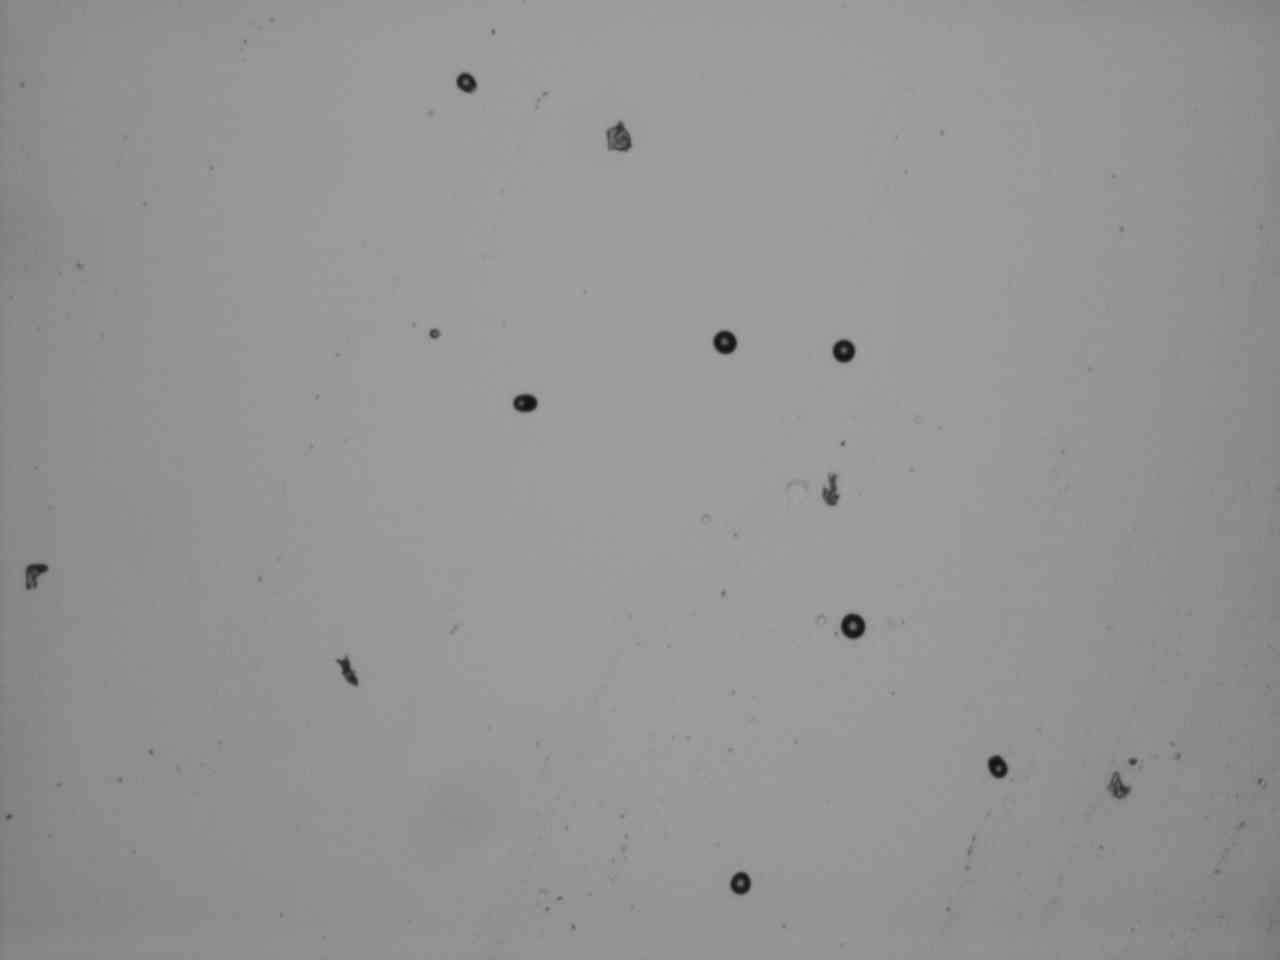
Figure 9
Two clusters produced during experiment III. Each photographed area is 1000 by 1300 microns; each magnification is X40.
= = = = = = = = = = = = = = = = = = = = = = = = = = = =
13) The cluster in Figure 10B is very peculiar. This becomes evident when it is seen under the usual magnification, as in Figure 11. The tracks are very close to each other; they can be surrounded by a circle whose diameter is comparable to ranges of alpha particles in CR-39 (10) or in the electrolyte.
= = = = = = = = = = = = = =
(A)
 . (B)
. (B) 
Figure 10
Two more clusters produced during Experiment III. The photographed area in A is 1000 by 1300 microns, under magnification X40. The photographed area in B is 200 by 260 microns, under higher magnification X200.
= = = = = = = = = = = = = = = = = = = = = = = = = = = =
On that basis it is reasonable to suspect that several near-by tracks might be due to alpha particles emitted from a tiny grain of radioactive material, such as radium or uranium. Similar patterns of near-by tracks, named rosettes, were reported by Oriani. He considers them to be part of unexplained background rather than clusters due to electrolysis.
= = = = = = = = = = = = = =
 .
.Figure 11
A rosette cluster produced during the experiment III. The photographed areas is 1000 by 1300 microns; magnification is X40. The etching time was 6 hours. Notce the usual low background, outside the rosette -- typically 0.5 tracks per field of that size.
= = = = = = = = = = = = = = = = = = = = = = = = = = = = = = =
4) Clusters due to residual activity
14) Residual activity has been mentioned in Section 1 above. It is presumably induced in O-rings during electrolysis. Before using O-rings in the electrolytic cell (to induce residual activity) Oriani exposes them to CR-39 detectors, for many days, This is done to demonstrate that no alpha radioactive contamination is present on the surfaces. My own examination of new Oriani O-rings confirmed absence of measurable surface contamination. A test for residual activity begins after O-rings are removed from the electrolytic cell, usually after about four days of electrolysis. Oriani does this in his laboratory and sends the O-rings to those who desire to replicate experiments. A residual-activity test in progress is shown in Figure 12.
= = = = = = = = = = = = = =
(A)
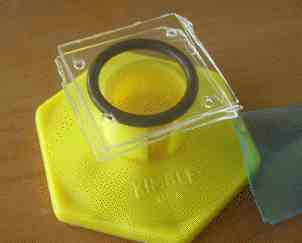
Figure 12
Residual activity setup. An O-ring is sandwiched between two CR-39 chips. The setup is supported by a test tube holder. A film of protective plastic, unpeeled from a chip, is shown on the right.
= = = = = = = = = = = = = = = = = = = = = = = = = = = =
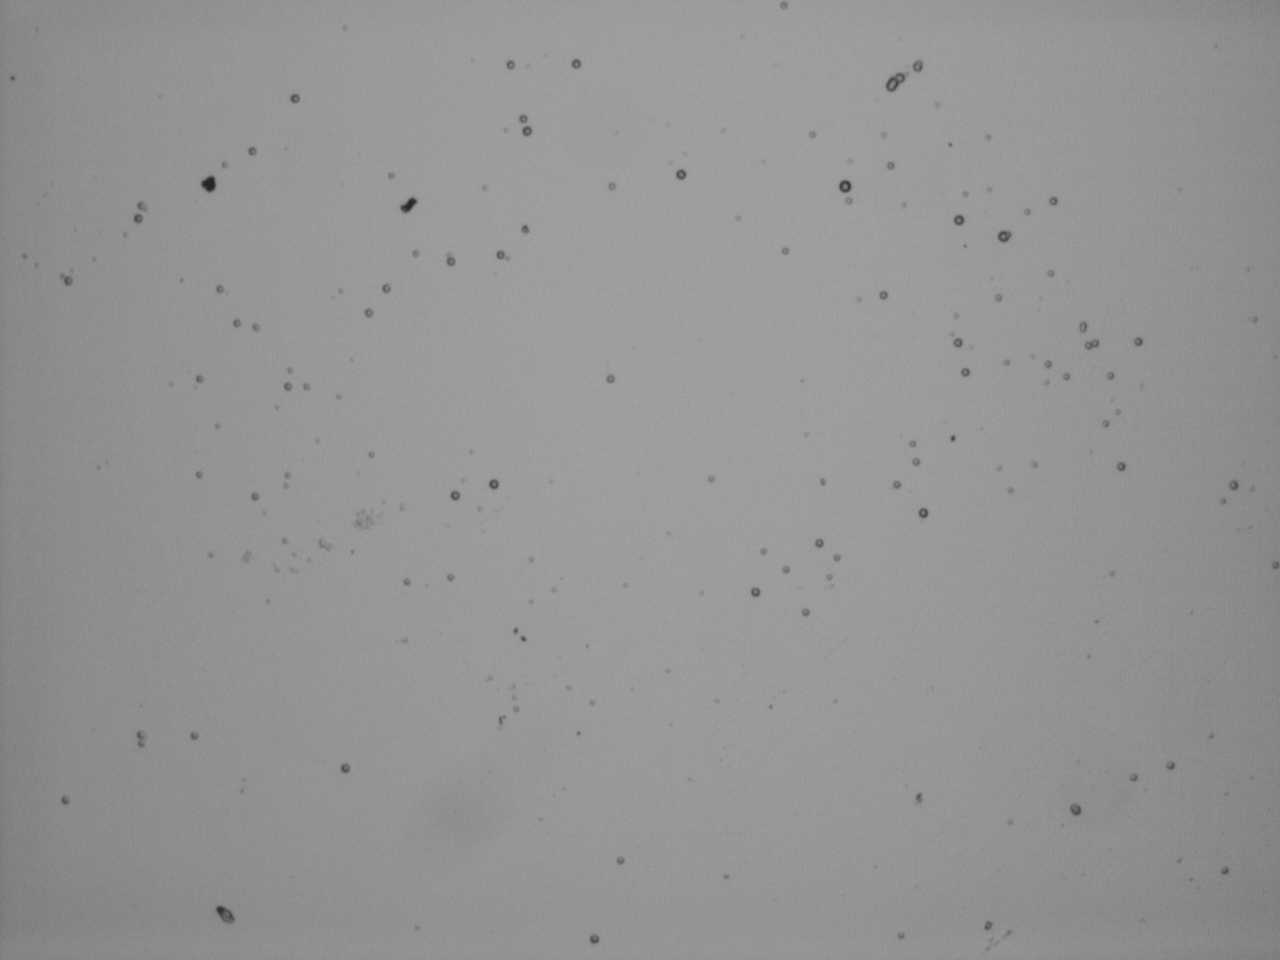
15) Two large clusters (about 6000 by 6000 microns each) were produced in Experiment VIII, one on each chip. The areas are much larger than for clusters produced during the electrolysis. Unfortunately, my lowest magnification, X40, was still too high to produce single pictures of entire clusters. Only centers of these clusters are shown in Figure 13. The average densities within these clusters turned out to be close to 250 tr/cm2. This is 17 times higher than the mean backgrund.
= = = = = = = = = = = = = =
(A)
 . (B)
. (B) 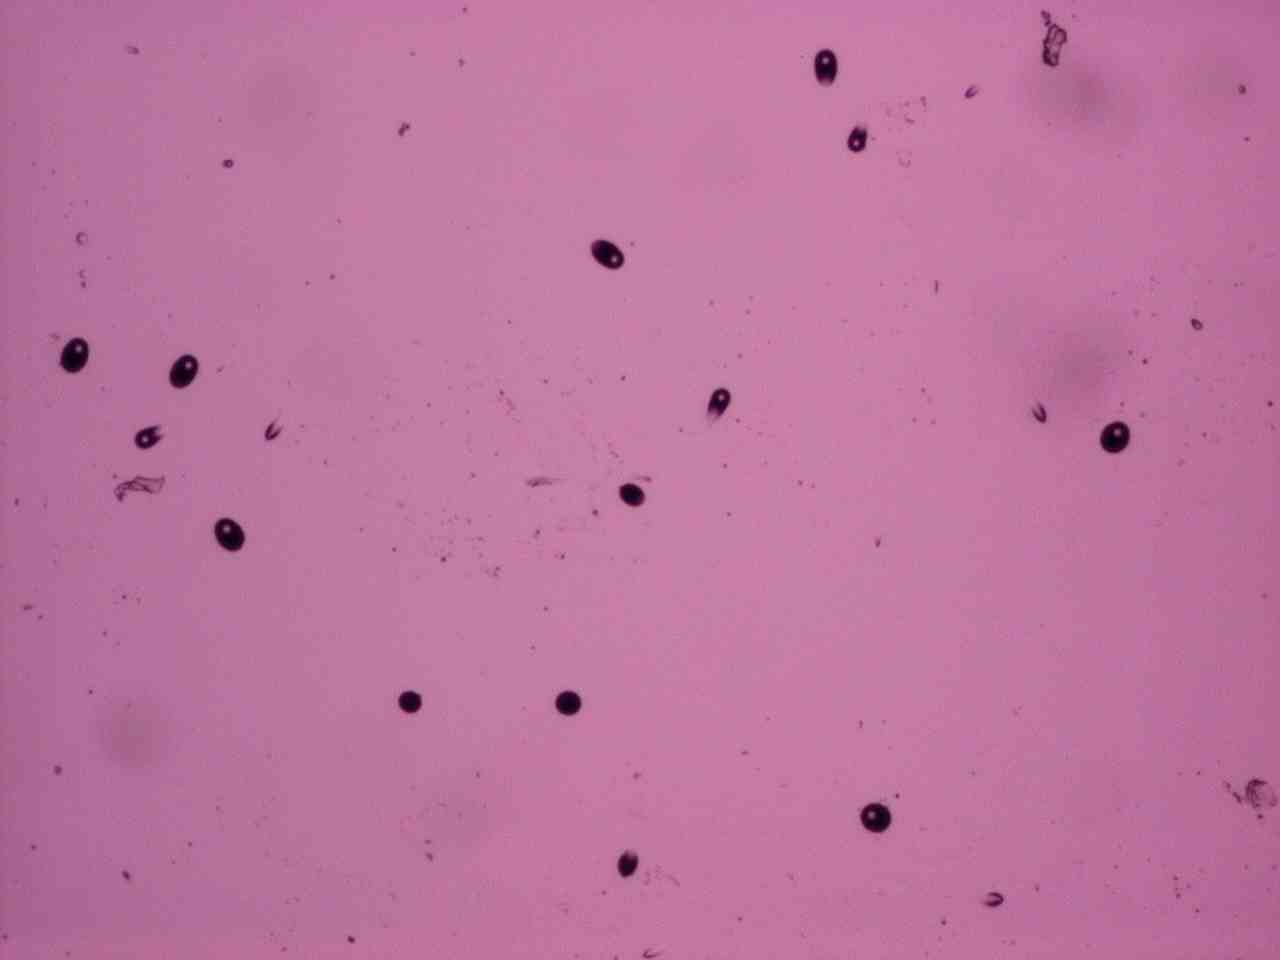
Figure 13
Central areas of tracks from two large clusters produced in Experiment VIII. Each photographed area is 1300 microns by 1000 microns; magnification is X40.
= = = = = = = = = = = = = = = = = = = = = = = = = = = =
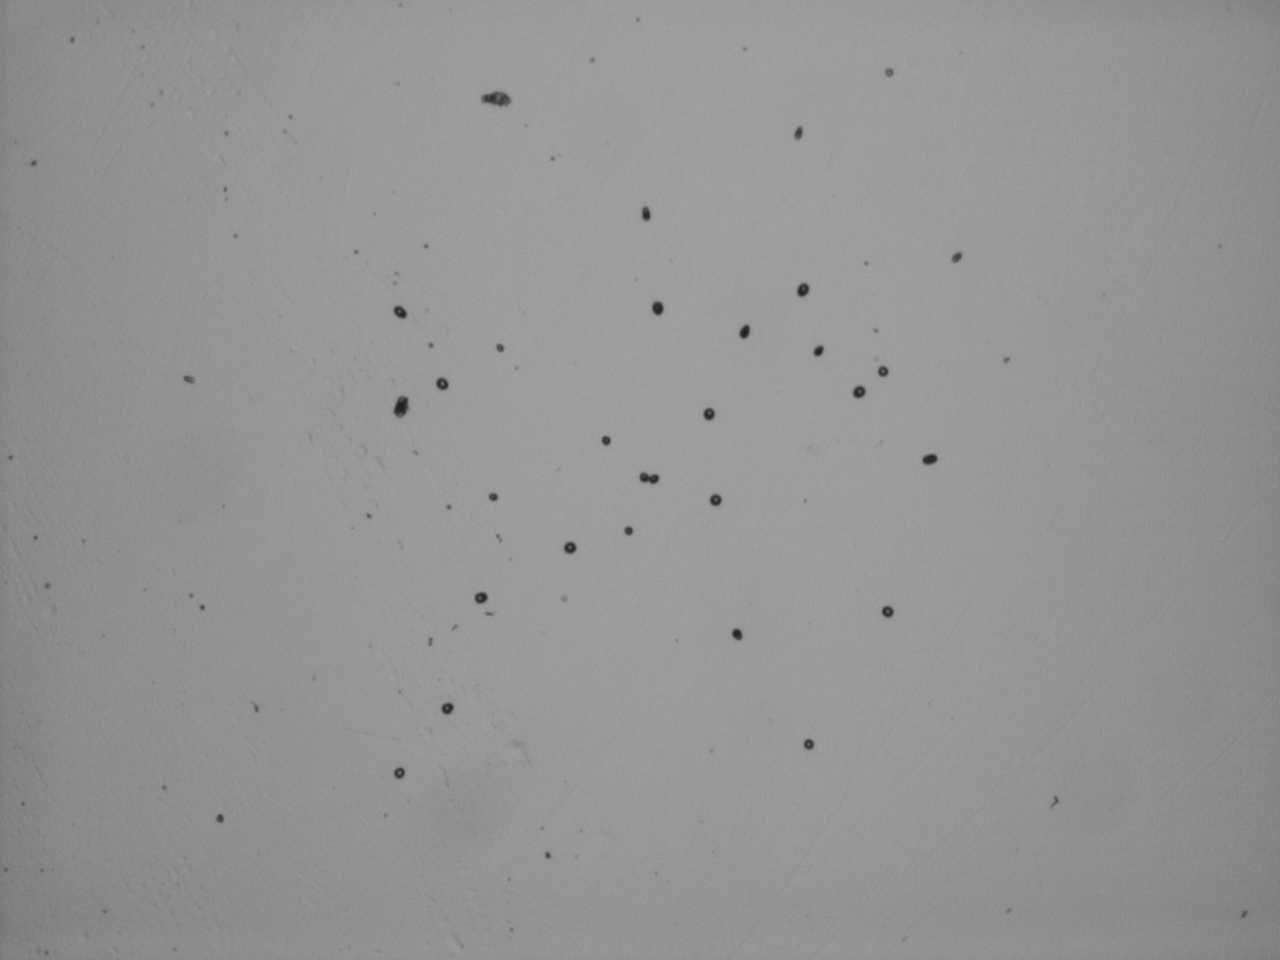
16) A very small cluster, also from experiment VIII, is shown in Figure 14A. Its tracks are nearly twice as large as tracks of alpha particles, shown in Figure 14B. Alpha particles were recorded at a corner of the chip on which the small cluster was found. That means that etching conditions were identical. What kind of projectiles can produce tracks two times larger that those due to alpha particles of 4 MeV? Note that tracks in Figure 13 are also different from tracks due to alpha particles from my source. But they are not larger. The local density of 13 large tracks in Figure 14 A is about 5000 tr/cm2. This is 330 higher than the mean background.
= = = = = = = = = = = = = =
(A)
 . (B)
. (B) 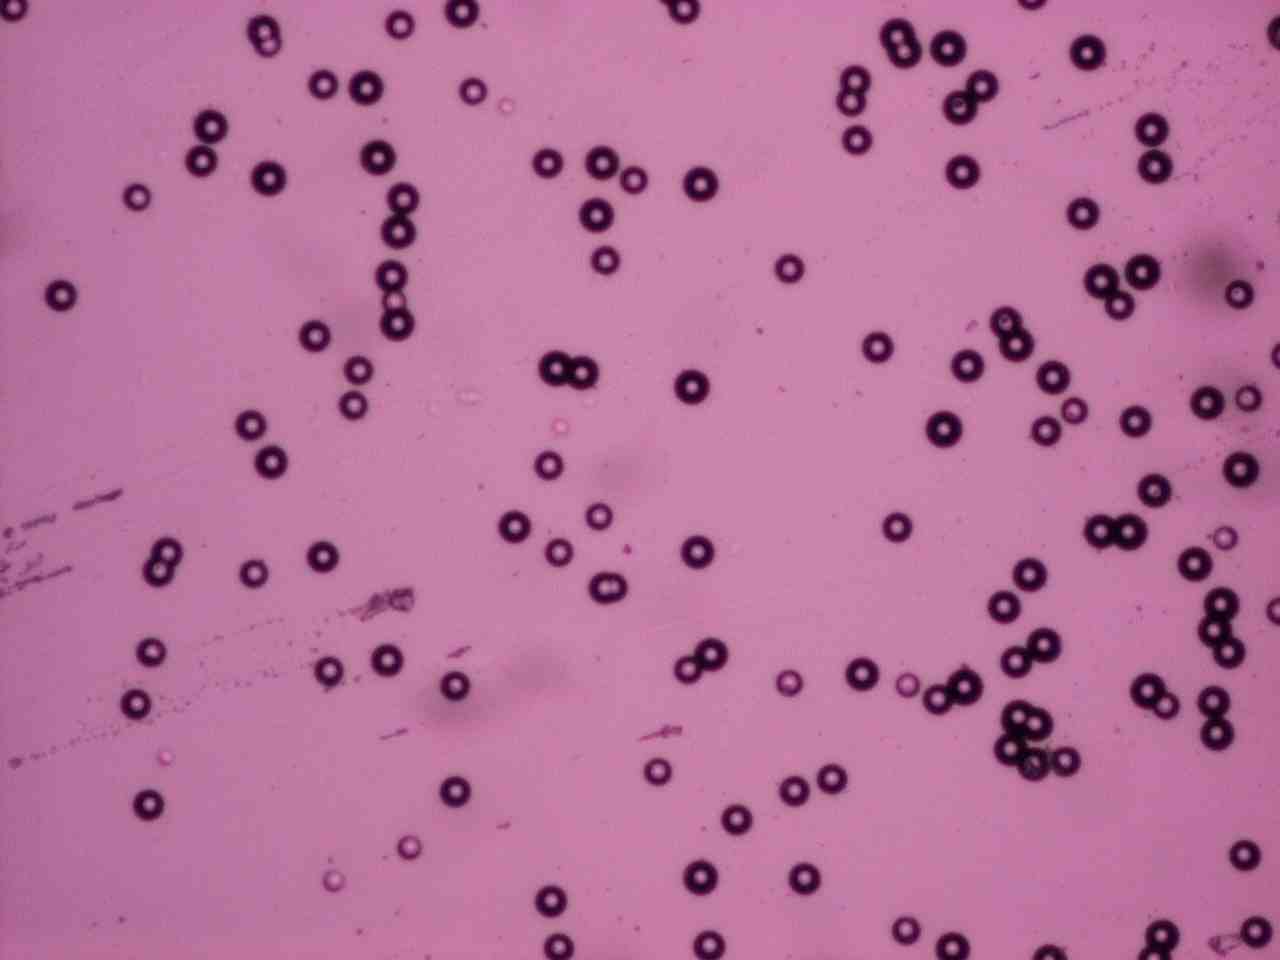
Figure 14
(A) A small cluster of very large tracks from experiment VIII. (B) Tracks of alpha particles of approximately 4 MeV. Each photographed area is 1300 microns by 1000 microns; the magnification is X40.
= = = = = = = = = = = = = = = = = = = = = = = = = = = =
5) Clusters of electrolysis tracks reported by other investigators
A photo of a cluster, recorded by Oriani during electrolysis experiment, is shown in Figure 15. The mean track density, within the shown cluster area (about 1 mm2) is close to 22000 tr/cm2. This is at least 5000 times larger than the expected background.
= = = = = = = = = = = = = =
(A) --->
 .
. Figure 15
Oriani’s cluster recorded in CR-39 during electrolysis. The number of tracks in that cluster is about 220. The total photographed area of that composite photo was approximately 760 microns by 1300 microns. Orientations of elliptical tracks near the cluster periphery seem not to be random.
= = = = = = = = = = = = = = = = = = = = = = = = = = = =
17) Figure 16 shows two clusters recorded by John Fisher during electrolysis. The chips were sent to me and I photographed the cluster. The large fuzzy spots are tracks on the opposite side of the CR-39 chip. Their sizes are exaggerated because tracks on the other side are out of focus. The cluster was located on that part of the chip that was in air during the three day-long experiment.
= = = = = = = = = = = = = =
(A)
 . (B)
. (B)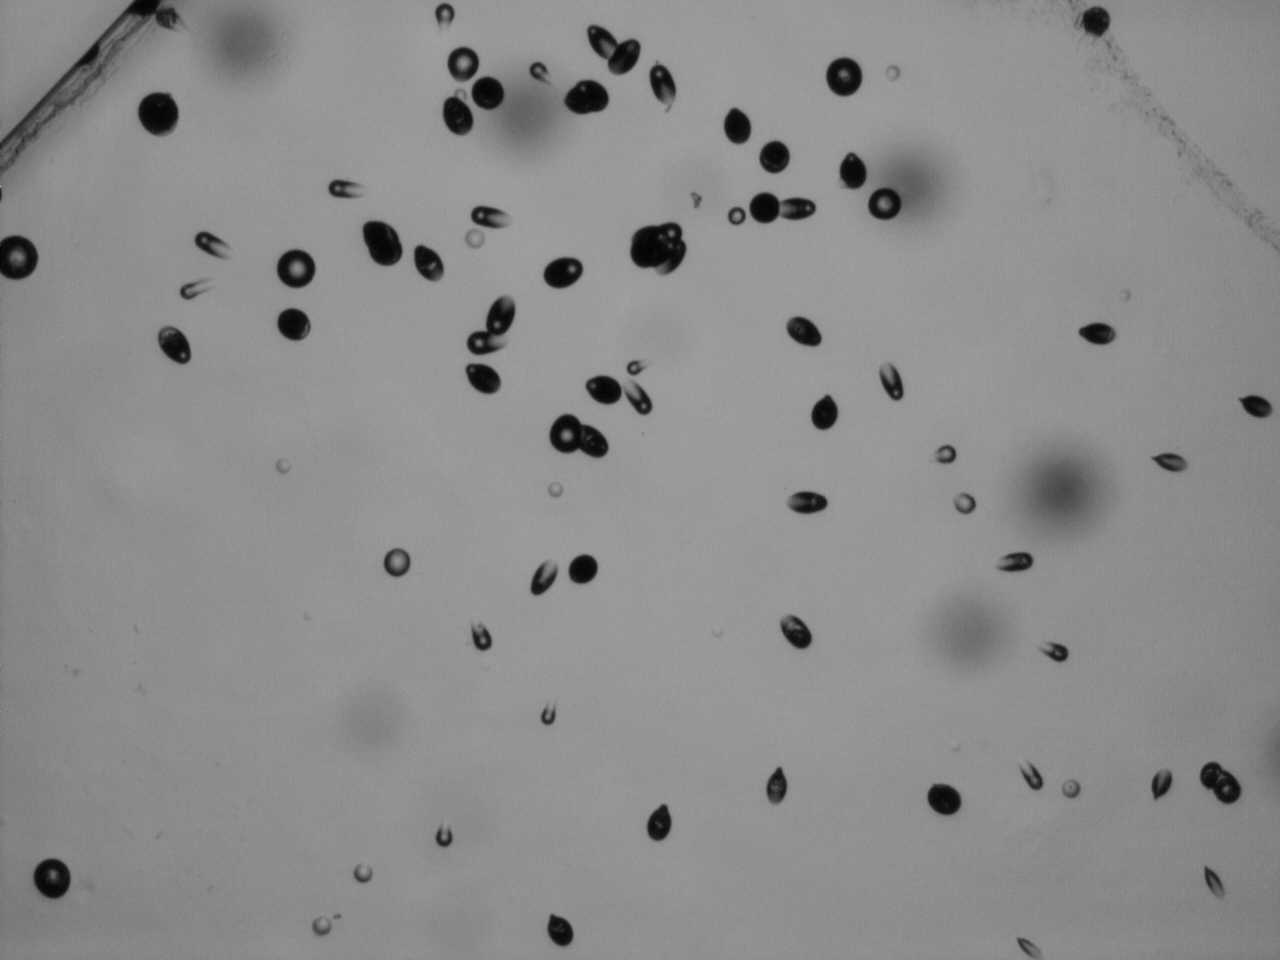 .
.Figure 16
Two of Fisher clusters recorded in CR-39 during the electrolysis. The magnification was 40 and the photographed area was 1300 microns by 1000 microns.
= = = = = = = = = = = = = = = = = = = = = = = = = = = =
19) Figure 17 shows an electrolysis cluster reported by Marissa and Scott Little (9). In posting the picture Marissa wrote: “There is an obvious cluster of tracks on the chip! The cluster is on the side facing away from the cathode and is outside the o-ring area. There are several, much smaller clusters on the area outside the o-ring as well (containing 3-10 tracks.)” Most of the tracks are inside an area whose diameter is about 1400 microns. The mean track density, in this area, is close to 6000 tr/cm2. This is about 1300 times higher as the average background on their new CR-39. At the time of this writing Scott and Marissa are trying to disprove their “null hypothesis.” According to that hypothesis, excess tracks are due to radioactive contamination, most likely to a radon progeny.
= = = = = = = = = = = = = =
(A) --->
 .
. Figure 17
Little’s cluster recorded in CR-39 during electrolysis. It was the only large cluster produced in 30 experiments. The magnification was 40 and the photographed area has the diameter of 2800 microns.
Clustering of tracks indicate that nuclear reactions are localized in space. Unfortunately, clustering tells us nothing about localization in time. Are clusters produced in sudden bursts of activity or via slow accumulation of tracks? Such questions can not be answered by those of us who use CR-39 detectors. But they are likely to be answered by users of electronic detectors. Data collected by these detectors can be recorded frequently, for example every six hours, without interrupting long experiments. Electronic detectors, providing information about energies of intercepted particles, can also be used to identify particles.
= = = = = = = = = = = = = = = = = = = = = = = = = = = =
6) Discussion:
20) The cluster shown in Figure 5 B has 109, plus or minus 10 tracks; the uncertainty is due to the arbitrary value of the “threshold of rejection.” That is a common problem in counting tracks on CR-39 surfaces, especially when these surfaces are not clean. The most remarkable feature of that cluster is a large number of nearly-elliptical tracts. Orientations of these tracks are certainly not random. Frank DiBianca, after seeing the picture spent some time in tracing straight lines along the focal axes of non-circular tracks, as illustrated in Figure 18. Considering the angular uncertainties in drawing the lines, and possible scattering effects, the picture is consistent with the idea that all lines intersect at one point. The diameter of the small circle, 75 microns, is about ten times smaller that the diameter of the area in which most of the tracks are located. The size of the cluster is large in comparison with ranges of typical alpha particles. For 6 MeV particles, for example, the range in CR-39, or in electrolyte, is close to 50 microns (10). A similar set of lines can be drawn through numerous elliptical tracks shown in Figure 1.
= = = = = = = = = = = = = =
(A) ->
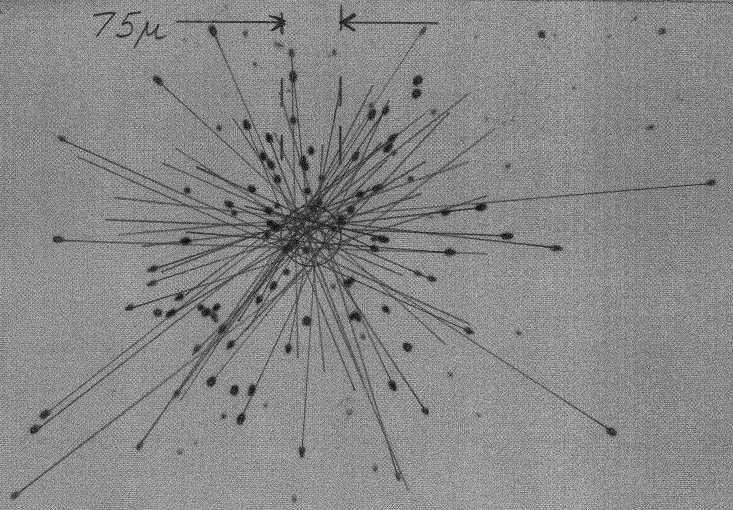
Figure 18
This picture shows tracks already seen in Figure 5 B. The photographed area is 1000 by 1300 microns; magnification was X40.
= = = = = = = = = = = = = = = = = = = = = = = = = = = =
21) One additional feature should be noted on Figures 5B and 1. Tracks near the centers of clusters are frequently round while tracks near peripheries of the cluster are mostly elliptical. In fact, the average ellipticity seems to increase with the distance from the central region. It is certainly too early to speculate about significance of such patterns. Also significant are locations of my clusters. Some of them, as in Figure 5A, were found on the upper CR-39 surface (facing the mylar foil and the electrolyte) while others, as in Fig 5B, were found on the lower surface (facing air below the cell). The cluster shown in Figure 1 was not produced on the CR-39 surface facing the O-ring; it was produced on the surface separated from the O-ring by about 1 mm of CR-39 plastic. The same was reported about the cluster shown in Figure 17. It is tempting to speculate that observed tracks result from collisions between protons in CR-39 (C12H 18O7) and some kind of neutral particles. Neutral particles do not ionize matter directly; that is why they can travel long distances before colliding with protons. I am not going to elaborate on this because my goal, at this stage, is to convince myself (and others) that Oriani cluster effect is real. In my opinion, theoretical considerations should wait till experiments become reproducible. It is remarkable that clusters of charged particles, reported in 2004 (3) have been observed in recent experiments of Richard Oriani, Marissa Little, John Fisher and myself. Something interesting is going on and research in this area should continue.
22) Is it possible that observed clusters are due to well known processes? One trivial explanation has already been mentioned, it is possibly the presence of tiny grains of alpha-radioactive substances, as in Figure 3B. Another has to do with cosmic rays. Let me address them, one after another, in the context of clusters from Figure 1 and 5 B. A grain of alpha radioactive substance, such as uranium, would produce tracks whose orientations are random, except when sizes of clusters are not much larger than ranges of alpha particles. Orientations of tracks in Figure 5B (and also in Figure 1) are certainly not random. That is a sufficient argument for rejecting the idea of contamination, as far as I am concerned. Another strong argument against contamination is total absence of clusters on numerous control chips (see the Appendix).
23) Can clusters be due to cosmic rays? Collisions in which relativistic heavy ions disintegrate, producing showers of nucleons, have been studied by using high energy accelerators, for example, at Brookhaven National Laboratory. Suppose that most of the tracks identified in Figure 5 B are due to neutrons and protons resulting from total disintegration of a single ultra-relativistic ion, somewhere near the detector. What is the probability that such ion can be found at sea level? Fortunately, this question has already been answered. According to (11), the theoretically calculated flux, for ions with Z=25, at see level, is 10-34 particles per m2 per second. This translates to about 3*10-21 particles per km2 per year. For particles with much higher Z the expected flux is many orders of magnitude smaller.
24) The second cosmic ray phenomenon to consider are showers. Primary cosmic ray charged particles, mostly protons, interact with the atmosphere by producing showers of pions and muons. Can a cluster seen in Figure 5B be due to such particles? The answer is a definite no. The ionization density of pions and muons is too low to produce tracks in CR-39 detectors. I am familiar with one study (12), conducted at Brokhaven National Laboratory, in which CR-39 chips were coated with fissionable material and exposed to beams of pions with several energies between 500 MeV and 2300 MeV. The purpose was to measure cross sections of fission induced by pions. This was done by counting tracks due to fission fragments. The reported cross sections indicate that billions of pions traverse CR-39 chips for each set of fission fragments. Observation of fission fragment tracks would not be possible if individual pions could form tracks in CR-39 detectors. Cosmic ray showers, by the way, are known to be very wide, near sea level. On that basis I am inclined to conclude that small clusters observed in my experiments were not due to cosmic rays.
10) Appendix:
26) A friend who read the above asked for more information about control experiments. Here is a brief summary of facts:
a) Six electrolysis experiments were conducted but only two (I and III) produced clusters. In other words, two successes (seven clusters and one rosette) and four failures -- to replicate clusters during electrolysis.
(b) Four residual activity experiments were conducted but clusters were observed in experiment VIII only. In other words, one success (three clusters) and three failures.
(c) Not a single cluster was found on control chips. During the experiments, control chips were exposed to air (in the same room but away from the electrolytic cell and from the seeded O-rings). Two CR-39 control chips, A and B, were used in parallel with Experiment I. Chip A was covered by the original blue protective coating while the coating was removed from chip B. Chip B was exposed to air while chip A was squeezed between two O-rings and two flat plates. Four screws were used to apply pressure to the O-Orings. That pressure was higher than in the electrolytic cell. The mean track density on Chip A was ~3 tr/cm2 ; the mean track density on chip B was ~8 tr/cm2 . The conclusion was that mechanical pressure, applied to a CR-39 chip through O-rings, does not produce excessive track-looking defects. In a private message Oriani wrote that the mean background on his control chips was 16.6 tr/cm2 , with, standard deviation of 9.7 tr/cm^2. My control-experiment results also fluctuated widely around ~15 tr/cm2 . Note that even a high, 25 tr/cm2 , translates into 0.35 tracks per my 1.3 by 1.0 mm field. Fortunately, fluctuations of background densities are inconsequential; local densities within clusters turned out to be at least 100 times higher.
(d) Absence of clusters on the chip used in the electrolysis experiment II is convincing evidence that neither electrolyte nor the O-rings were contaminated with grains of an alpha-radioactive material, such as 212Pb, 226Ra or 238U. I am referring to the suspicion that the electrolyte, or the O-rings, might have been contaminated with such material during Experiment I. If this were true then Experiment II would also produce clusters. The electrolyte and the O-rings, used in Experiment II (21 days of electrolysis) were the same as in Experiment I (5 days of electrolysis). The number of clusters produced in Experiment II would exceed the number produced in Experiment I. Zero clusters in experiment II versus eight clusters in experiment I is not consistent with the idea of contamination. But it is consistent with the idea of irreproducibility.
(e) John Fisher suggested that additional CR-39 chips should be placed in air, very close to the cell. That was on the day 3 of Experiment II. I did this. Four small (about 1 by 2 cm) chips were placed next to the cell for the remaining 18 days of electrolysis. No clusters were recorded on these chips. This is an acceptable argument against absence of tiny alpha-radioactive aerosoles in air.
(f) Absence of clusters on chips used in residual activity experiments VII, IX and X is also acceptable evidence against the suspicion that seeded O-rings were contaminated with tiny grains of an alpha-radioactive material.
(g) The overall conclusion is that something interesting is going on, and that additional investigations are needed. Absence of reproducibility is the most disturbing thing in this episode. But this should not prevent us from further investigations. A clear yes-or-no answer, about nuclear effect due to electrolysis, will be found, sooner or later. Absence of reproducibility does not mean that a phenomenon is unreal; it means that we must learn how to control it.
11) References:
1) A. G. Lipson et al., Proceedings of ICCF10, page 539 (2003). Also see
Fussion Tech. 38,238, (2000) and Bull. Lebedev Phys. Inst. 10, 22, (2001).
2) F.W. Keeney at al., Proceedings of ICCF10, page 509 (2003).
3) R. A. Oriani and J. C. Fisher: “Detection of energetic charged
particles during electrolysis;” Proceedings of ICCF10, 2003, pp 577-584.
Also see Jpn. J. Appl. Phys. 41,6180, 2002 and two papers in the proceedings
of ICCf11, 2004, pp 281-303)
4) P.A. Mossier-Boss et al., “Production of high energy particles using the Pd/D
co-deposition process.” Paper presented at the APS meeting, March 5, 2007, Denver
Colorado. Also see Naturwissenschaften (2007) DOI 10.1007/g00114-007-0221-7.
5) Oriani; draft of an unpublished manuscript, August 2007. That draft can be seen at:
http://csam.montclair.edu/~kowalski/cf/333oriani2007.html
6) S. Krivit in the November 2006 issue of New Energy Times (items 7 and 8) at
http://newenergytimes.com/2006/NET19.htm
7) Radon Division of Landauer Inc. (http://www.landauerinc.com/contact/)
8) D. Nikezic and K.N. Yub, “Formation and growth of tracks in nuclear track
materials” in Material Scince and Engineering, R46 (2004) p 51 to 123.
9) Marissa and Scott Little -- See their website http://www.earthtech.org/PACA/logbook.html 10) R.P. Henke and E.V. Benton. “Charged particles tracks in polymers,”
Naval Radiological Defence Lab; Technical report AD06611796, Octiber 3, 1967.
11) P.B. Price; “Do energetic heavy nuclei penetrate deeply into Earth’s
atnosphere?”;Proc. Natl. Acad. Sci. USA, vol77, No 1, pp 44-48, January 1980
12) H.M. Khan et al., Nuclear Physics A vol 781, Issue 3-4, 15 January 207, pp 296-305.
Click to see the list of links