|
|
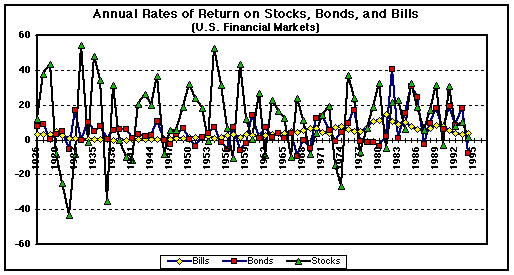
| Is there a positive relationship between risk and return? Data on annual rates of return to stocks, bonds, and bills in U.S. financial markets for the period 1926-1994, provide evidence of a direct relationship between risk and return. Stocks, which have the highest volatility in annual returns over the period, have produced higher average annual rates of return than bonds, which are relatively less volative. In turn, rates of return to investment in bonds are higher than average rates of return on bills. It is this basic relationship between risk and return that forms the cornerstone of modern finance. |
Annual Rates of Return Bills Bonds Stocks 1926 3.27 7.77 11.62 1927 3.12 8.93 37.49 1928 3.24 0.10 43.61 1929 4.75 3.42 -8.42 1930 2.41 4.66 -24.90 1931 1.07 -5.31 -43.34 1932 0.96 16.84 -8.19 1933 0.30 -0.08 53.99 1934 0.16 10.02 -1.44 1935 0.17 4.98 47.67 1936 0.18 7.51 33.92 1937 0.31 0.23 -35.03 1938 -0.02 5.53 31.12 1939 0.02 5.94 -0.41 1940 0.00 6.09 -9.78 1941 0.06 0.93 -11.59 1942 0.27 3.22 20.34 1943 0.35 2.08 25.90 1944 0.33 2.81 19.75 1945 0.33 10.73 36.44 1946 0.35 -0.10 -8.07 1947 0.50 -2.63 5.71 1948 0.81 3.40 5.50 1949 1.10 6.45 18.79 1950 1.20 0.06 31.71 1951 1.49 -3.94 24.02 1952 1.66 1.16 18.37 1953 1.82 3.63 -0.99 1954 0.86 7.19 52.62 1955 1.57 -1.30 31.56 1956 2.46 -5.59 6.56 1957 3.14 7.45 -10.78 1958 1.54 -6.10 43.36 1959 2.95 -2.26 11.96 1960 2.66 13.78 0.47 1961 2.13 0.97 26.89 1962 2.73 6.89 -8.73 1963 3.12 1.21 22.80 1964 3.54 3.51 16.48 1965 3.93 0.71 12.45 1966 4.76 3.65 -10.06 1967 4.21 -9.19 23.98 1968 5.21 -0.26 11.06 1969 6.58 -5.08 -8.50 1970 6.53 12.10 4.01 1971 4.39 13.23 14.31 1972 3.84 5.68 18.98 1973 6.93 -1.11 -14.66 1974 8.00 4.35 -26.47 1975 5.80 9.19 37.20 1976 5.08 16.75 23.84 1977 5.12 -0.67 -7.18 1978 7.18 -1.16 6.56 1979 10.38 -1.22 18.44 1980 11.24 -3.95 32.42 1981 14.71 1.85 -4.91 1982 10.54 40.35 21.41 1983 8.80 0.68 22.51 1984 9.85 15.43 6.27 1985 7.72 30.97 32.16 1986 6.16 24.44 18.47 1987 5.47 -2.69 5.23 1988 6.35 9.67 16.81 1989 8.37 18.11 31.49 1990 7.81 6.18 -3.17 1991 5.60 19.30 30.55 1992 3.51 8.05 7.67 1993 2.90 18.24 9.99 1994 3.90 -7.77 1.31 1995 5.53 30.38 34.11 1996 5.15 -0.35 20.26 1997 5.08 15.46 31.01 1998 1999 2000
Basic Correlation Among Bills, Bonds, Stocks, and Inflation Bills Bonds Stocks Inflation Bills 1.000000 Bonds 0.235999 1.0000000 Stocks -0.05139 0.14696567 1.000000000 Inflation 0.417264 -0.1484981 -0.017734421 1.000000 Mean Levels of Risk and Rates of Return to Alternative Assets (unadjusted for inflation) Mean 3.74 5.16 12.16 Standard Deviation 3.29 8.75 20.35 Coefficient of Variation 0.88 1.70 1.67
Selected References: Bodie Zvi and Robert C. Merton. Finance. (Upper Saddle River, N.J. Prentice-Hall, 1998).
Kolb, Robert. Financial Derivatives. (Miami, Florida: Kolb Publishing Company, 1993).
Kolb, Robert. Futures, Options, and Swaps. (New York: Basil Blackwell Publishers, 1994)
Levy, Haim, and Marshall Sarnat. Porfolio and Investment Selection: Theory and Practice (New York: Prentice-Hall, 1984).
Luenberger, David G. Investment Science (New York: Oxford University Press, 1998).
Saunders, Anthony. Financial Institutions Maagement. (Burr Ridge, Ilinois: Richard D. Irwin, 1994).
Van Horne, James C.. Financial Market Rates and Flows, fifth edition. (Upper Saddle River, N.J.: Prentice-Hall, 1998)
_________"A Survey of the Frontiers of Finance," The Economist, (October 9, 1993), pp. 1-22.
Last Updated on 2/399
By Phillip LeBel
Email: